


Announcement

Now Available!
Get your copy of the 7th Annual State of Smart Manufacturing and hear from 300+ manufacturers in this new survey report!
Subscribe to Our Blog
For a monthly digest of expert insights, data points, and tips like the ones in this article.
April 22, 2020

This week’s global data marks a turning point: the decline of manufacturing production is starting to flatten, and in some regions and industries, even shows an upturn in activity. For instance, let's first look at two of our bigger data sets – manufacturing in the United States and China, both of which are showing signs of improvement (see graphs below).
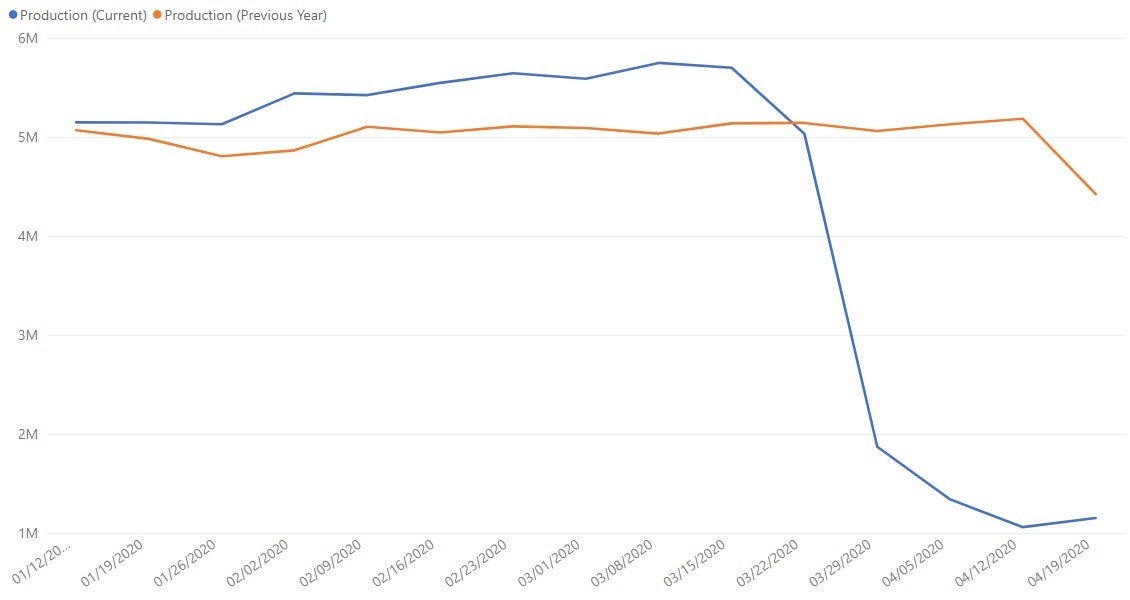
U.S. data set
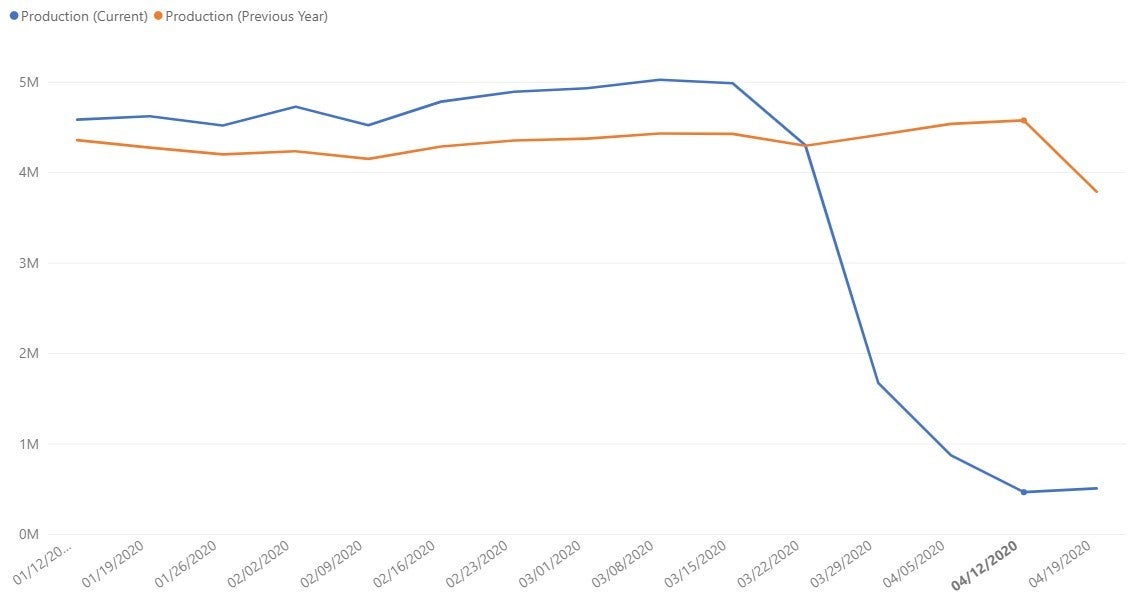
China data set
The U.S. is starting to see an uptick in activity. This positive trend is reflected in nearly all segments we track (including automotive, food and beverage, electronics, etc.), suggesting that we’re seeing a real-time view of what is considered “essential.” China’s decline has flattened, and in the last week even showed a slight increase in its manufacturing production after peaking on March 22, with aerospace/defense and general manufacturers (which serve a variety of industries) showing increases in production, despite continued decreases in local automotive production.
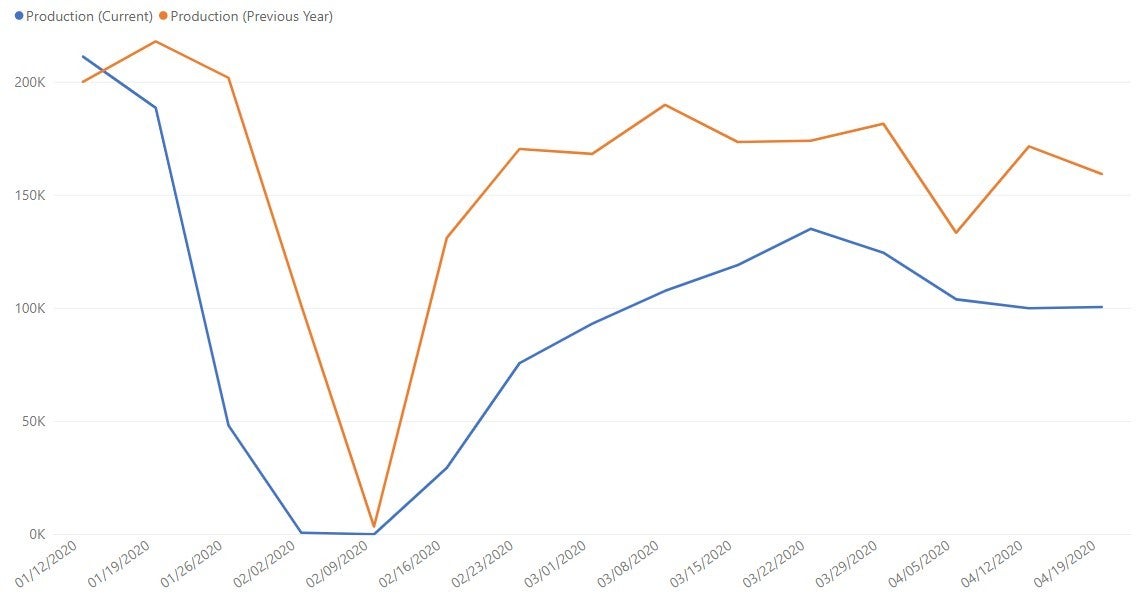
Global automotive data set
The global automotive industry is seeing its first increase, albeit modest, in production since peaking the week of March 1. Contributing to this increase could be the industry’s ability to quickly pivot to create medical devices and supplies, including efforts by manufacturers Creative Foam to manufacture foam parts for ventilators and Desin, which added a production line to make face masks. This is a positive sign, and the news could get even better in weeks ahead: Given that the federal government recently categorized automotive manufacturing workers as essential, automakers are likely moving forward with reopening plans in May. This signals that the automotive supply chain could pick up production in as soon as two weeks.
Food and beverage & electronics industries 2020 data set
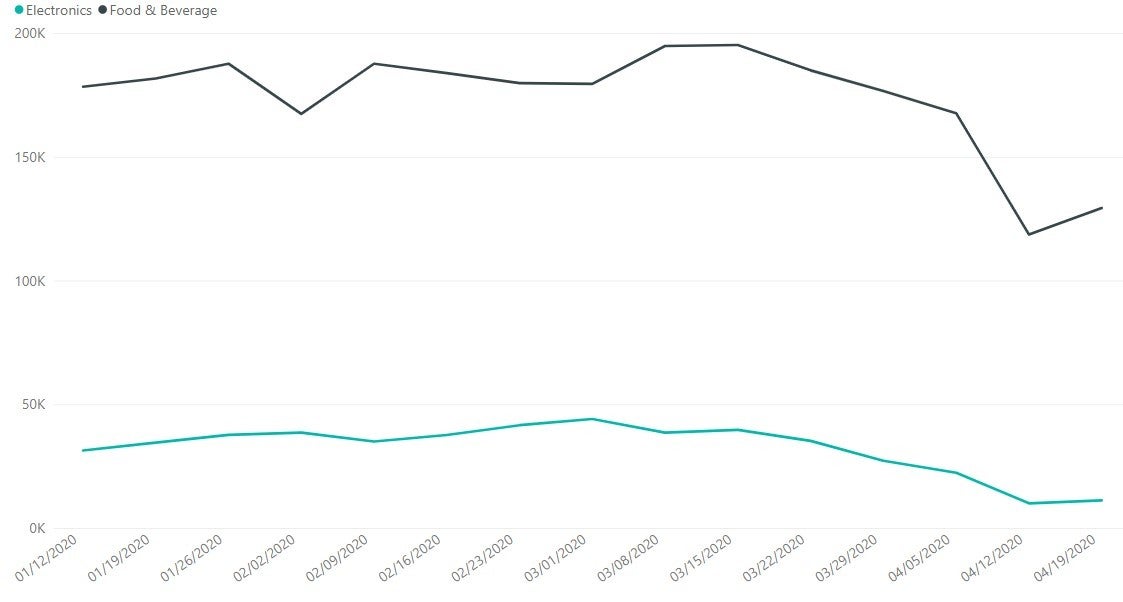
The food and beverage and electronics industries, which saw a dip in production last week, have also seen a slight uptick in activity. It remains to be seen whether this is long-term trend or an anomaly. Looking into a post-COVID-19 future, experts predict that trends that were already transforming these industries will pick up speed as a result of the virus’ impact. The electronics industry could see a surge in M&A activity with tech giants buying smaller struggling businesses. Particularly in food retail, hybrid locations could become the norm (think Ikea’s ability to be a furniture showcase, warehouse, and restaurant).
France, Germany, Italy, Spain 2020 data set
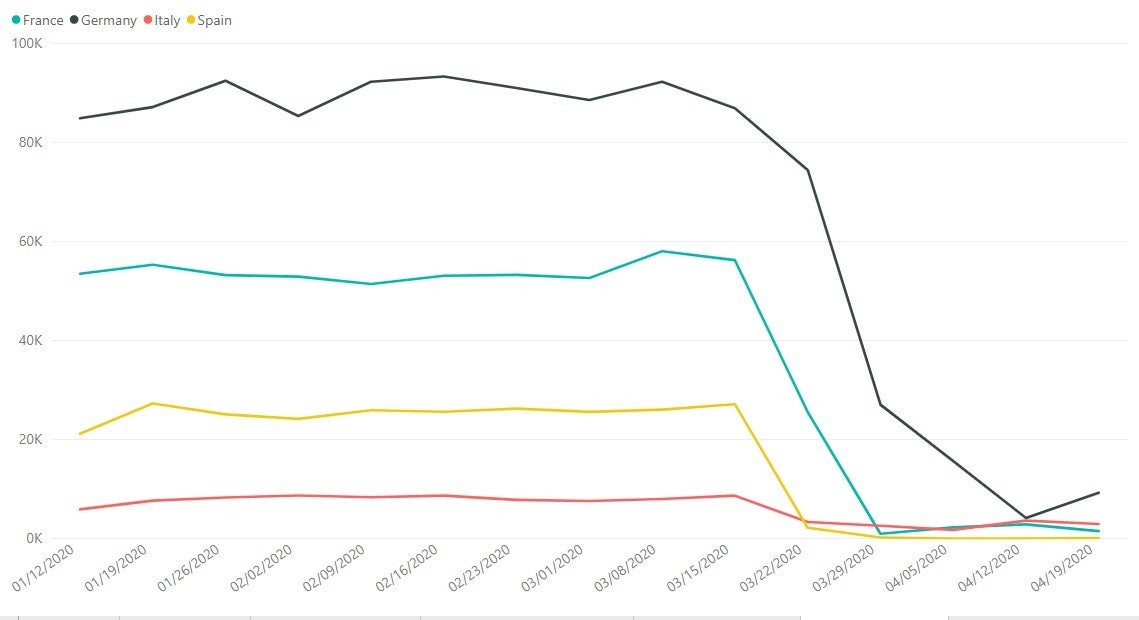
Some countries that saw very low levels of production are showing slight signs of recovery. Some saw increased production last week before falling again (France and Italy), while others are starting to see increased activity this week (Spain and Germany). Germany, for instance, began reopening non-essential businesses on April 19. We should expect the situation to remain fluid given that the data set coming from these countries is relatively small, but we would expect that as these countries see signs of improved recovery from COVID-19, manufacturing would as well.
What’s Next
Globally, pockets of countries, regions, and states are starting to experience flattening of the curve whereas others are just starting to accelerate. While global manufacturing production may model China’s example of cyclical gains followed by periods of decline in production, it’s possible that regions that took less strict measures to control the spread of the coronavirus might see longer periods between increases and decreases in production, ultimately experiencing a longer economic recovery. We remain cautiously optimistic about continued stabilization, and even increases, as companies are given the green light to reopen.
Details on the Data Source & How to Interpret Graphs
Plex Systems solutions are cloud-based, giving us access to 20 years of anonymized, compiled operational data from the approximately 700 manufacturers we serve. This group collectively runs 1,200 active production facilities in 29 countries, representing the aerospace, automotive, fabricated metals, food and beverage, industrial machinery, and plastics and rubber industries. For scale, in the fourth quarter of 2019 alone, this group together processed over 1.4 million shipments. Daily, they record upwards of 8 billion transactions (such as barcode scans, moved inventory, shipments, etc.).
Note this data reflects two periods of production activity to compare year-over-year trends: the blue trend line is production transactions from January 1, 2020 to April 19, 2020 and the orange trend line indicates production transactions from January 1, 2019 to April 19, 2019 (see x-axis, with dates noting the end of the tracked week). Keep in mind that Plex customers added more facilities in 2020, so it’s not necessarily important to look at the absolute number of transactions (see Y-axis) but rather the relative shape of the curves year-over-year. There is a margin of error of +/- 2%.
A note on this week’s data: Most graphs above indicate a steep drop in activity in April in 2019. This decrease indicates the annual drop in production around the Easter holiday, including Good Friday. You’ll note this did not occur as dramatically in 2020, likely due to most production activity already being at rates considered essential.
About the Author
Jerry Foster Chief Technology Officer, Plex Systems