

Announcement

Now Available!
Get your copy of the 7th Annual State of Smart Manufacturing and hear from 300+ manufacturers in this new survey report!
Subscribe to Our Blog
For a monthly digest of expert insights, data points, and tips like the ones in this article.
Global Manufacturers Close the Pandemic-Produced Production Gap
Big Data, Cloud ERP Technology, Manufacturing Intelligence
November 19, 2020

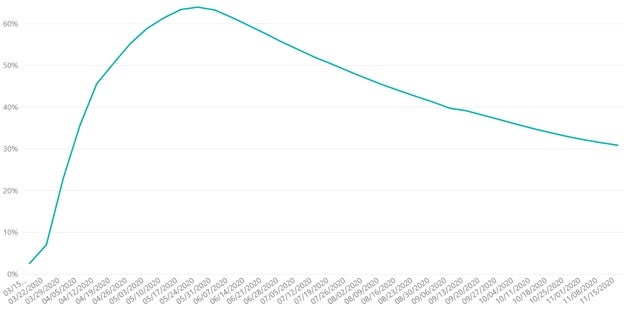
Global manufacturers are now operating at 103% of pre-COVID rates of activity. This effort is steadily closing the production gap caused by the pandemic earlier this year (with this gap defined as the difference between the anticipated 2020 production volume based on historical data compared to real-time activity).
As of mid-November, manufacturers are seeing a 31% cumulative production loss to date, compared to the 56% production loss sustained between early March through the end of June (as indicated in the chart below; see teal line).
Global production gap
North America production data
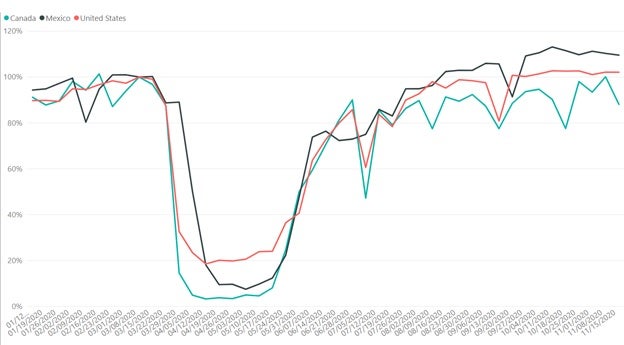
In North America, production volume is holding steady at 103%. In the U.S., manufacturers have continued to demonstrate resiliency, maintaining production despite record-setting new cases of COVID-19 across the country. While some states have begun enforcing varying versions of stay at home orders, manufacturers in those regions are not showing significant drops in production activity as a result. The Association of Manufacturing Technology also reported a recent uptick in machine tool orders this fall, indicating that U.S. manufacturing is continuing its recovery.
In Mexico, production has cooled slightly over the last few weeks, settling at 110% of pre-COVID rates after experiencing a year-to-date high of 113% on October 11. In the last three weeks, while Canada has seen variation week over week, the country is demonstrating gradual improvement when compared to early August.
Europe production data
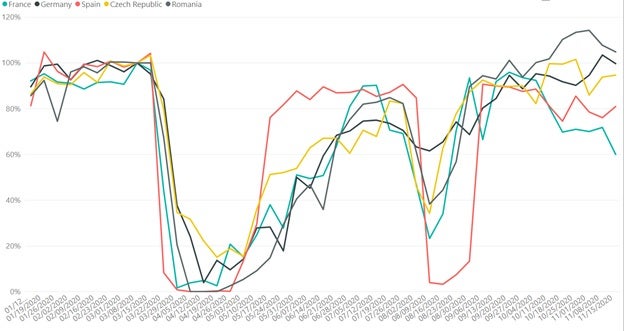
Europe, which is in the midst of a second wave, appears to be more impacted either by local outbreaks or local drops in demand – showing slightly less resiliency than U.S. manufacturers. Three of the European countries we track show a drop in activity in the last three weeks, though in the last week alone, Spain and the Czech Republic have seen an uptick in activity, while Germany, Romania and France have seen declined activity. France is now dropped to approximately 60% of pre-COVID rates of production.
China production data
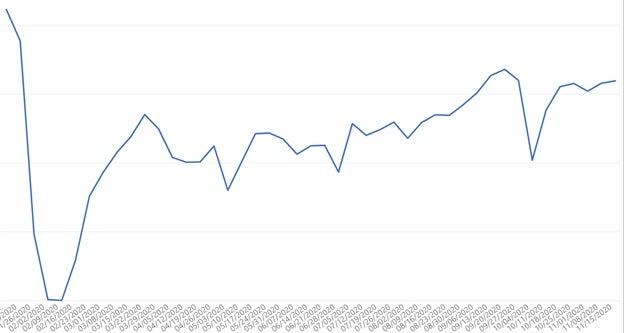
While Asia is averaging at 77% of pre-COVID rates of production overall, China is showing the second-highest spike in activity since early March. China’s manufacturing sector has also expanded for six straight months, according to a local Purchasing Managers’ Index. If year-over-year trends continue, China could see a steady incline through mid-December.
Users v. production
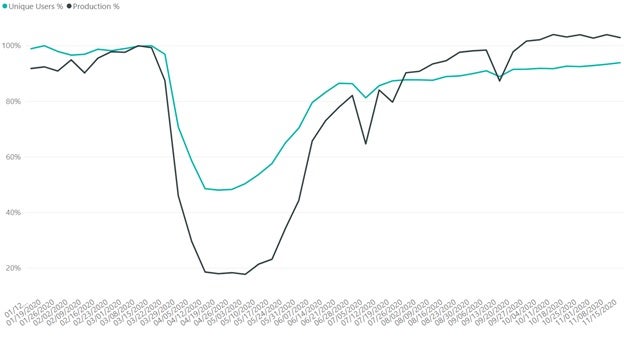
According to the latest U.S. jobs report from the Department of Labor Statistics, the manufacturing industry added 38,000 jobs in October. While the industry still employs 621,000 fewer people than it did in February, we are also seeing a steady incline within our data since mid-July on a global scale. Since July 12, the number of unique users logging in (teal line, above) has increased from 85% to 93%. While this hasn’t increased at nearly the same rate of production during that same time period (see black line, which increased from 84% to 102%) it is showing an appetite among manufacturers to hire workers. Anecdotally, some of the manufacturers we work with have experienced challenges hiring enough workers to match demand, and have been increasingly relying on automation tools and adding shifts to meet their high levels of production.
Future Outlook
Should current production rates continue, we expect the production gap to shrink to around 26-28% by the end of December 2020. And, with most manufacturing jobs (including those that can’t be managed remotely) exempt from new work restrictions in the U.S., we’re cautiously optimistic that manufacturers will continue to close that gap without disruption through the end of 2020, despite new cases continuing to increase around the world.
Details on the Data Source & How to Interpret Graphs
Plex Systems solutions are cloud-based, giving us access to 20 years of anonymized, compiled operational data from the approximately 700 manufacturers we serve. This group collectively runs 1,200 active production facilities in 35 countries, representing the aerospace, automotive, fabricated metals, food and beverage, industrial machinery, and plastics and rubber industries. For scale, in the fourth quarter of 2019 alone, this group together processed over 1.4 million shipments. Daily, they record upwards of 8 billion transactions (such as barcode scans, moved inventory, shipments, etc.). Note this data reflects production transactions from January 1, 2020 to November 15, 2020. There is a margin of error of +/- 2%.
About the Author
Jerry Foster Chief Technology Officer, Plex Systems
Jerry Foster is CTO and leads our technology strategy, along with research and design initiatives focused on next-generation cloud solutions for the manufacturing enterprise. A founding member of the Plex team, Jerry has been instrumental in the entire evolution of Plex, overseeing the technical transitions in each phase of our growth. Jerry earned his degree in Computer Science at Liberty University.