

Announcement
Now Available!
Get your copy of the 7th Annual State of Smart Manufacturing and hear from 300+ manufacturers in this new survey report!
Subscribe to Our Blog
For a monthly digest of expert insights, data points, and tips like the ones in this article.
Manufacturers Maintain Momentum, Make Progress on Production Losses
Big Data, Cloud ERP Technology, COVID-19 (Coronavirus), Manufacturing Intelligence
October 29, 2020
Global manufacturing data set
Global manufacturers are maintaining momentum, continuing to produce at 104% of pre-COVID levels of manufacturing production this week. North America is at 103% of pre-COVID levels of production, Europe is at 97% despite a second wave of coronavirus hitting the region, and production in Asia has reached 78%. While manufacturing activity on average appears to be normalizing, our data shows that between March and September, manufacturers saw a 37% drop in production compared to last year. However, the fourth quarter is already showing gains, dropping that gap to just 33%.
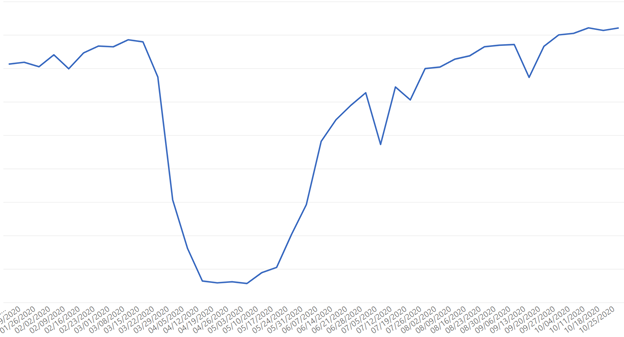
North America data sets
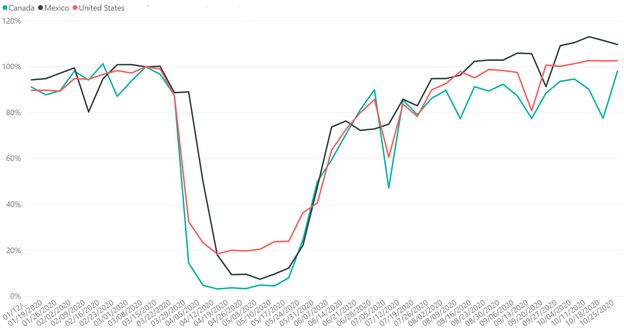
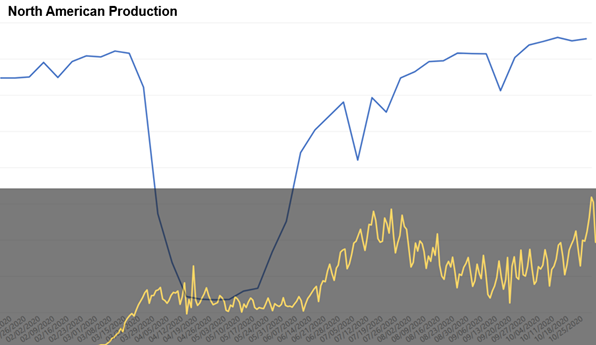
As you can see from the first North America Production Chart, above, manufacturing production in the U.S. has stayed relatively flat in the last six weeks, while Canada has seen a post-Canada Thanksgiving Day surge, hitting 98% of pre-COVID rates of production, a new record high. Production in Mexico has cooled slightly at 109% of production. The second chart averages North American production (see blue line), and overlays COVID-19 cases in the same period of time based on data shared by the European Centre for Disease Prevention and Control (see yellow line). This view demonstrates the resiliency of manufacturers: While COVID cases continue to fluctuate and most recently climb again, we’re seeing less reactivity within the rate of production among manufacturers. This suggests that these companies are able to continue to keep their workforce safe and maintain business continuity, despite local communities experiencing a rise in cases.
France, Germany, Spain, Czech Republic, Romania data set
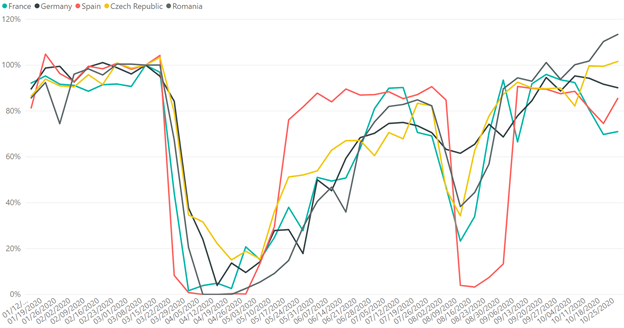
On a country-by-country basis, manufacturers in Europe are showing a mixed experience. While production within France, Spain, the Czech Republic and Romania have increased in the past week, Germany has had several consecutive weeks of declining activity. A new business climate index shows that Germany’s “manufacturing bosses are pessimistic about the months ahead.”
China data set
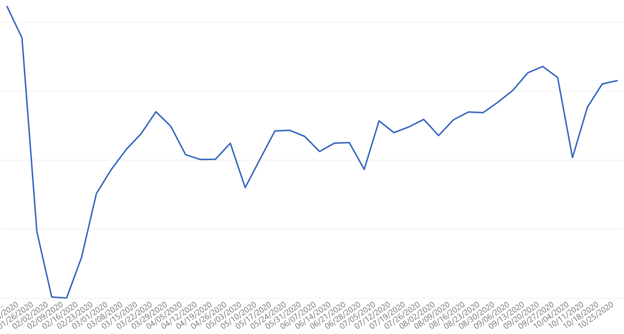
Following two consecutive weeks of declined activity due to Chinese National Day and Golden Week (Oct. 1-7), China has seen three straight weeks of production activity growth. Based on last year’s trends, we might see production continue to rise through the end of the year. Beyond manufacturing, the country’s overall economy is one of the strongest globally: “China posted 4.9% economic growth in its third quarter compared to the same period last year, keeping it on track to be the only major global economy to record an economic expansion this year in the midst of the novel coronavirus pandemic.”
Look Ahead
If year-over-year trends hold true, the coming eight weeks will show significant dips around the U.S. Thanksgiving, Christmas and New Year holidays. However, with U.S. manufacturers unable to keep up with demand for goods including cars, paint and appliances, we may see manufacturing continue to make up lost production time in the last quarter.
Details on the Data Source & How to Interpret Graphs
Plex Systems solutions are cloud-based, giving us access to 20 years of anonymized, compiled operational data from the approximately 700 manufacturers we serve. This group collectively runs 1,200 active production facilities in 29 countries, representing the aerospace, automotive, fabricated metals, food and beverage, industrial machinery, and plastics and rubber industries. For scale, in the fourth quarter of 2019 alone, this group together processed over 1.4 million shipments. Daily, they record upwards of 8 billion transactions (such as barcode scans, moved inventory, shipments, etc.). Note this data reflects production transactions from January 1, 2020 to October 25, 2020. Within the non-global manufacturing graphs from this week forward, we have removed the quantity of production transactions to clarify the significance of the trends the activity volumes indicate. There is a margin of error of +/- 2%.
About the Author
Jerry Foster Chief Technology Officer, Plex Systems
Jerry Foster is CTO and leads our technology strategy, along with research and design initiatives focused on next-generation cloud solutions for the manufacturing enterprise. A founding member of the Plex team, Jerry has been instrumental in the entire evolution of Plex, overseeing the technical transitions in each phase of our growth. Jerry earned his degree in Computer Science at Liberty University.