

Announcement

Now Available!
Get your copy of the 7th Annual State of Smart Manufacturing and hear from 300+ manufacturers in this new survey report!
Subscribe to Our Blog
For a monthly digest of expert insights, data points, and tips like the ones in this article.
While New COVID-19 Cases in Asia and Europe Flatten, Manufacturing Recovery Lags
COVID-19 (Coronavirus), Big Data, Manufacturing Intelligence
April 8, 2020

According to the latest Plex data on global smart manufacturing production, overall manufacturing activity (see graph, below) is still dropping, while reports that the rate of new COVID-19 cases in some Asian and European countries we’ve been tracking are flattening and slowing, respectively.

Here are some of the trends that Plex is seeing based on this week’s data, and possible outcomes in a post-COVID-19 world. Current graphs and more details on the data source are at the bottom of this post.
- The dynamic drop in global manufacturing production that started two weeks ago continues at a high rate, though is slowing slightly. However, this does not mean that the industry is recovering. The trend may instead reflect what is currently defined as “essential” manufacturing production activity.
- The food and beverage industry worldwide is experiencing a more moderate decline in the last week, compared with the automotive industry which continues its rapid decline (see graphs below). Anecdotally, when investigating our top producing food and beverage manufacturers, their production has remained fairly consistent since the beginning of February. For automotive manufacturers, we can reasonably expect activity to continue to remain low in the weeks ahead, with manufacturers including Honda and Fiat Chrysler planning to reopen facilities May 4 and Ford keeping plants closed “indefinitely” in the U.S. and Mexico, while hoping to open plants in Europe May 4. More on automakers’ plans for Europe can be found here.
- China’s production is seeing a second straight week of declining production activity, even though the country just reported no coronavirus deaths since it started publishing daily figures in January. While there are reported questions about the validity of the COVID-19 data being reported by China, other articles appear confident that cases are being contained, and they are in “suppression” mode to prevent a second widespread outbreak. Their continued recovery may positively influence manufacturing production in the weeks ahead.
- Italy, Spain, and Germany are three regions in Europe where daily new cases of COVID-19 are moderately slowing relative to the peak (which occurred within each country over the last week). Manufacturing activity in Italy and Germany continue to decline, however at a slower rate, consistent with overall global activity noted above, though experts warn Italy will be slow to recover: “‘With the Italian economy effectively shut down, it is unlikely that any recovery from the significant Covid-19 disruptions will be swift,’ said Lewis Cooper, an economist at IHS Markit.” The data that we have access to in Spain, albeit a small sample of manufacturing in country, however, shows zero production activity.
- The U.S. is still experiencing a decline in manufacturing activity and we should not anticipate a near-term recovery as the country reportedly heads into the two potentially deadliest weeks in the fight against COVID-19.
Overall, this week’s data builds upon broader, U.S. economic and industry-specific information shared at the beginning of the month. The Manufacturing Report on Business®, published by the Institute for Supply Chain Management, shows that manufacturing activity is in contraction, falling from 50.1 to 49.1, with food & tobacco manufacturing activity outperforming automotive manufacturing activity. Data from IHS Markit also reflects a market contraction, with their respondents showing a more significant slowdown, dropping from 49.6 in February to 40.5 in March.
According to Timothy R. Fiore, CPSM, C.P.M., Chair of the ISM® Manufacturing Business Survey Committee: growth expectations heading into April’s report are grim: “The coronavirus pandemic and shocks in global energy markets have impacted all manufacturing sectors. Among the six big industry sectors, Food, Beverage & Tobacco Products remains strongest, followed by Chemical Products, which in addition to the pharmaceutical component, is a significant contributor to the Food, Beverage & Tobacco Products Industry and beneficiary of low energy and feedstock prices. Transportation Equipment and Petroleum & Coal Products are the weakest sectors. Sentiment regarding near-term growth this month is strongly negative, by a 2-to-1 ratio.”
What’s Next
As we continue to watch certain countries in Europe, we will be analyzing whether it follows the same trend we see China, with manufacturing activity experiencing a resurgence approximately one month after experiencing a rapid decline. Whether following a similar trajectory or not, as more countries recover from COVID-19, we should be able to identify increasingly accurate models for manufacturing’s post-pandemic future.
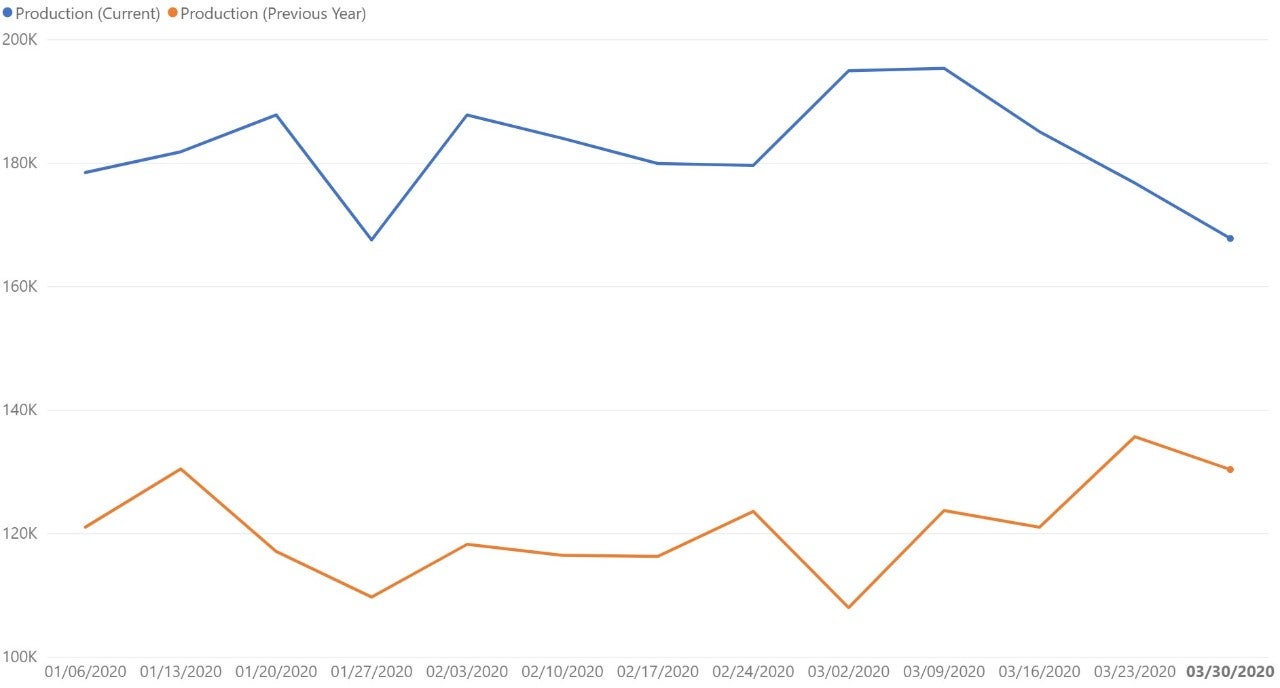
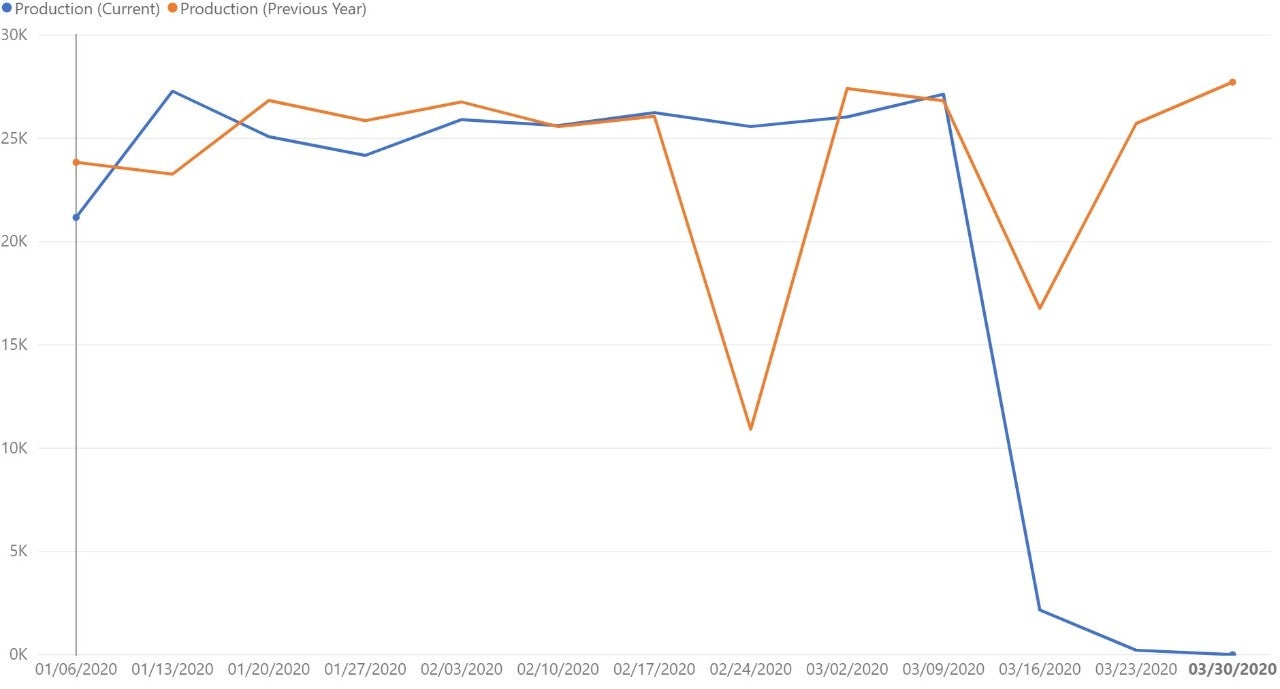
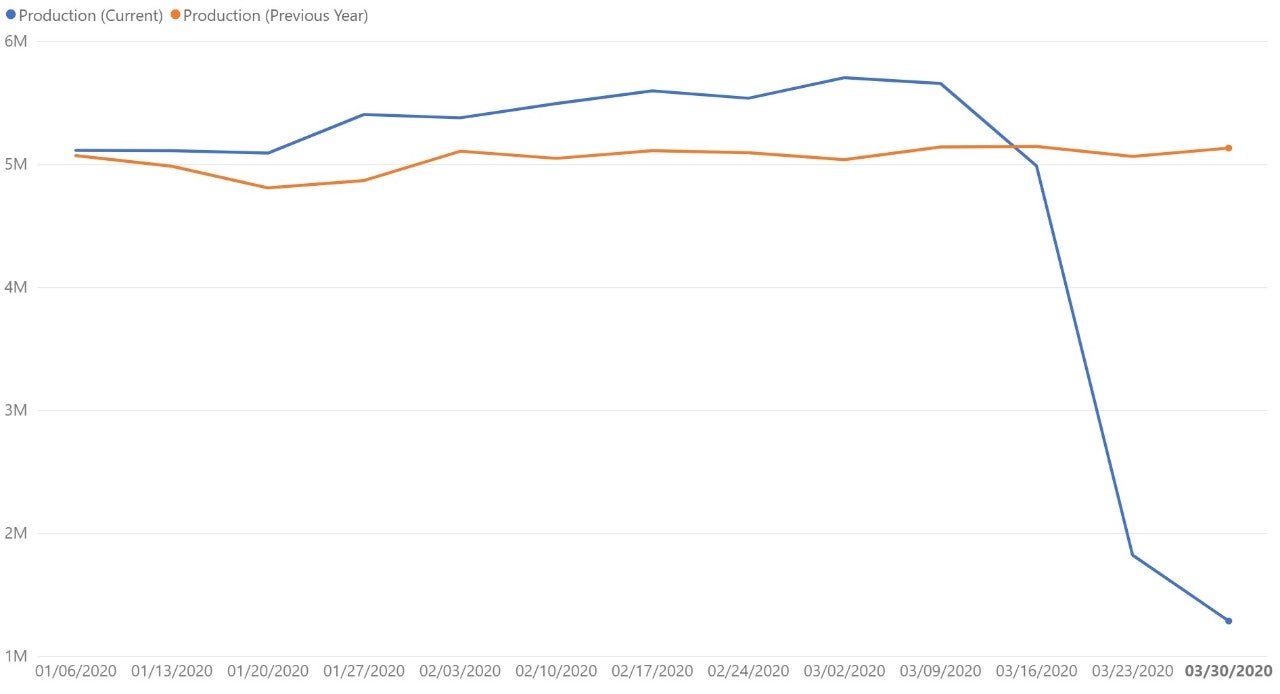
Global food and beverage data set
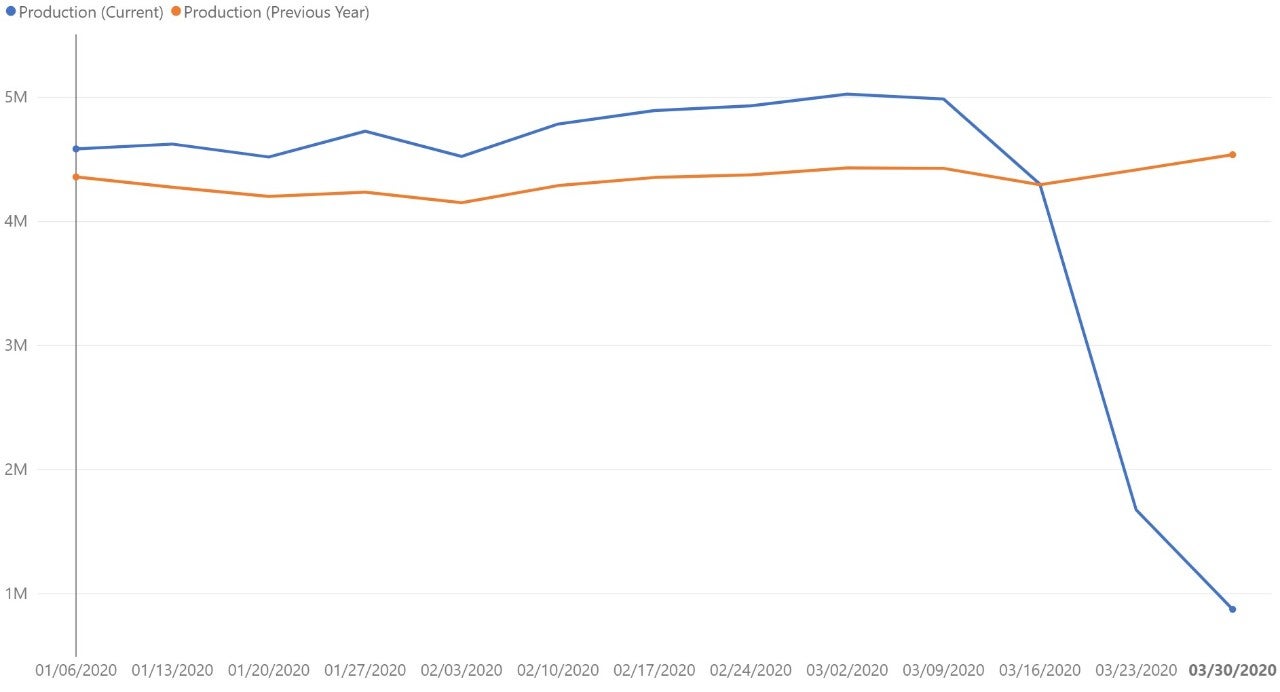
Global automotive data set
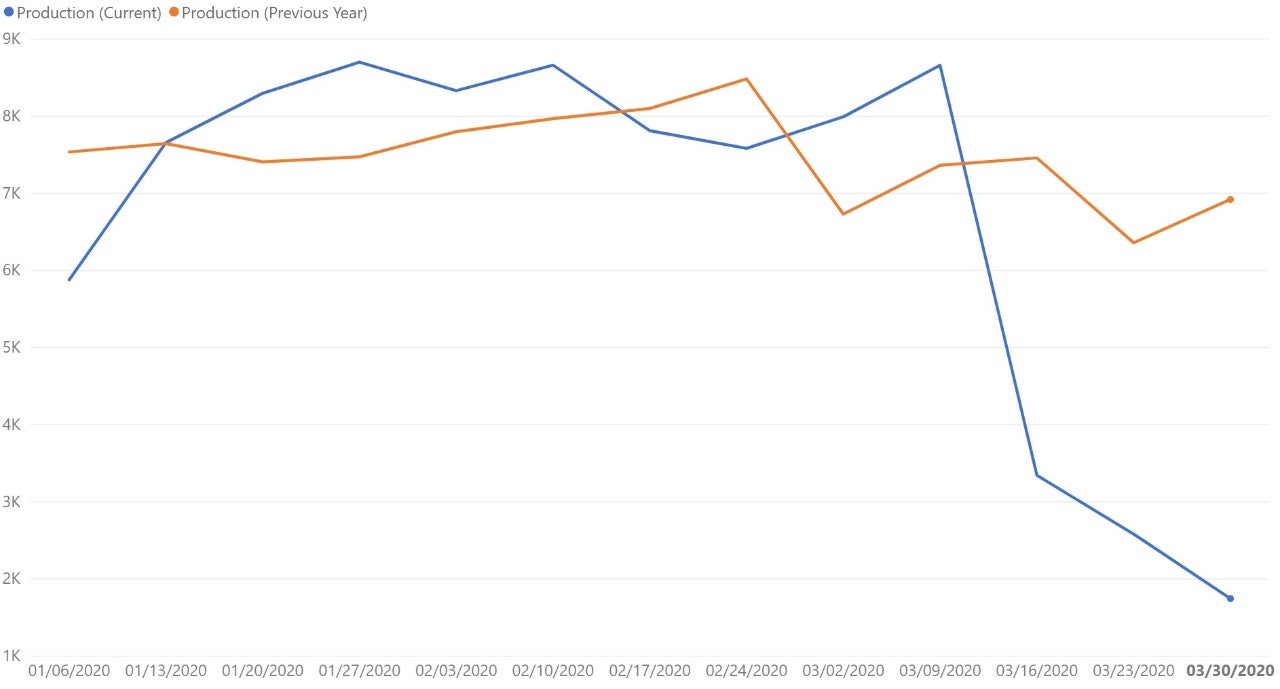
Italy data set
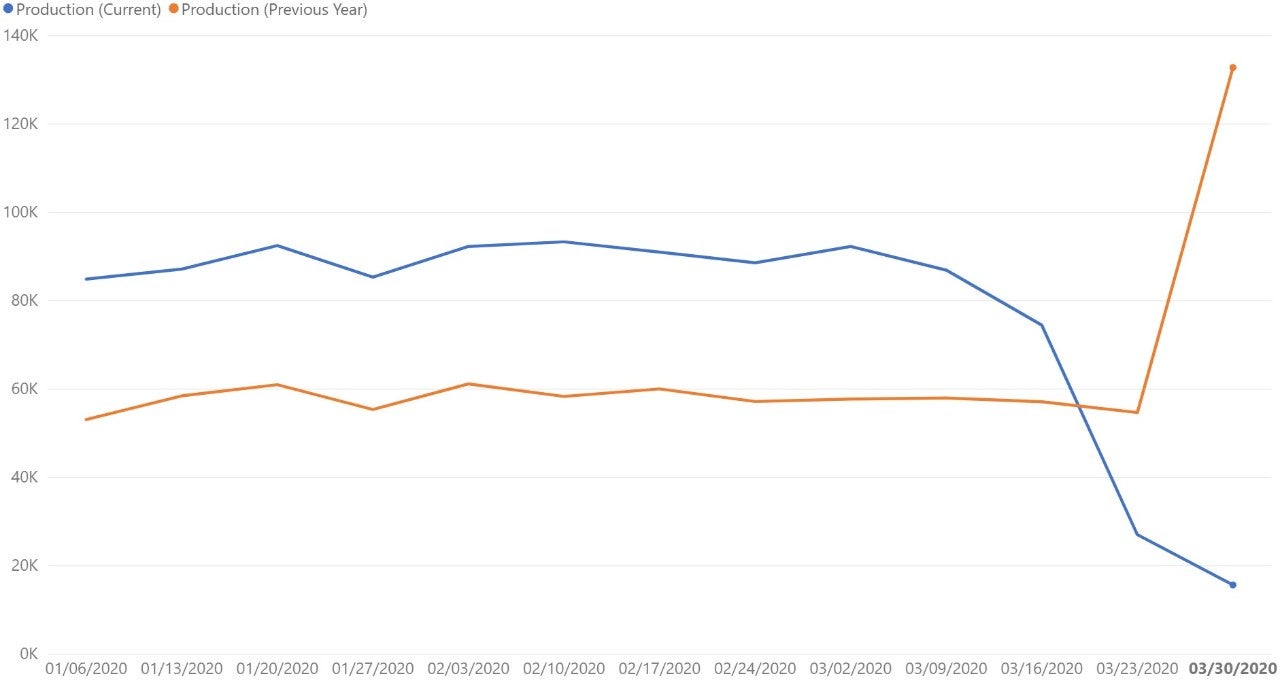
Germany data set (Please note the 2019 spike reflects plants coming online, reflecting increased activity.)
Spain data set
U.S. Data Set
Details on the Data Source & How to Interpret Graphs
Plex Systems solutions are cloud-based, giving us access to 20 years of anonymized, compiled operational data from the approximately 700 manufacturers we serve. This group collectively runs 1,200 active production facilities in 29 countries, representing the aerospace, automotive, fabricated metals, food and beverage, industrial machinery, and plastics and rubber industries. For scale, in the fourth quarter of 2019 alone, this group together processed over 1.4 million shipments. Daily, they record upwards of 8 billion transactions (such as barcode scans, moved inventory, shipments, etc.).
Note this data reflects two periods of activity to compare year-over-year trends: the blue trend line is production transactions from January 1, 2020 to April 5, 2020 and the orange trend line indicates production transactions from January 1, 2019 to April 5, 2019. Keep in mind that Plex customers added more facilities in 2020, so it’s not necessarily important to look at the absolute number of transactions but rather the relative shape of the curves year-over-year. There is a margin of error of +/- 2%.
About the Author
Jerry Foster Chief Technology Officer, Plex Systems
Jerry Foster is CTO and leads our technology strategy, along with research and design initiatives focused on next-generation cloud solutions for the manufacturing enterprise. A founding member of the Plex team, Jerry has been instrumental in the entire evolution of Plex, overseeing the technical transitions in each phase of our growth. Jerry earned his degree in Computer Science at Liberty University.