

Announcement

Now Available!
Get your copy of the 7th Annual State of Smart Manufacturing and hear from 300+ manufacturers in this new survey report!
Subscribe to Our Blog
For a monthly digest of expert insights, data points, and tips like the ones in this article.
Trends Indicate Return to “Normal,” China Sees Uptick in Activity
Big Data, Cloud ERP Technology, COVID-19 (Coronavirus), Manufacturing Intelligence
September 17, 2020
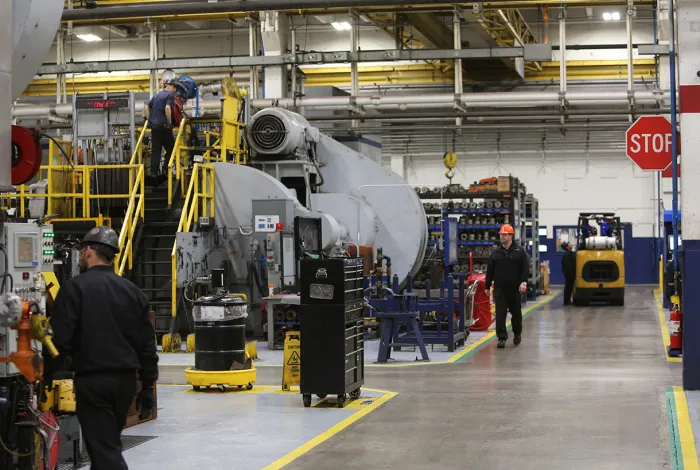
Much of the U.S. and Canada recognized Labor/Labour Day on Monday, September 7, resulting in an anticipated drop in manufacturing production in the past two weeks. However, this should be viewed as good news, as it indicates a return to pre-pandemic, or “normal” trends. While the U.S. and Canada saw a temporary decline, China, Europe and Asia overall continued to expand in the last two weeks, while Mexico has maintained its pre-COVID levels of activity.
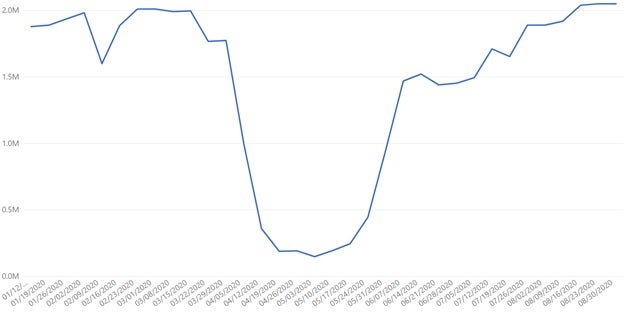
U.S. and Canada data sets
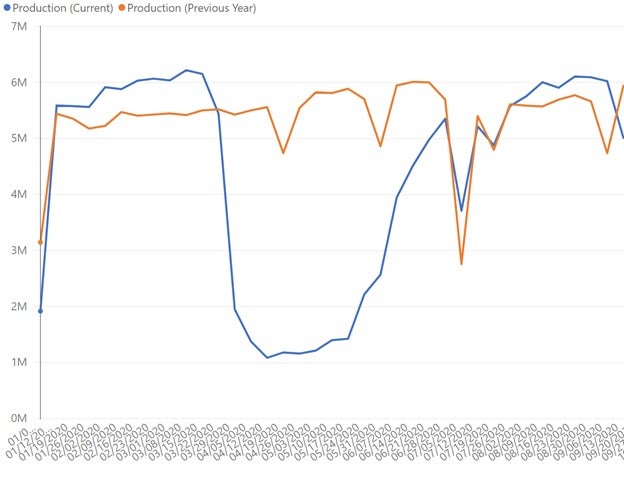
The chart above indicating 2019 activity (orange line) v. 2020 activity (blue line). If the post-Labor/Labour Day trends continue, we should see another leap in activity in the next two weeks. If this happens, these regions could potentially exceed pre-pandemic rates of activity.
China data set
Despite the U.S. government’s focus on reshoring incentives and ongoing trade discussions with China, the Chinese manufacturing community has shown significant growth over the past 6 weeks. Since August 2, production activity has increased 39%, bringing the region to 77% of pre-pandemic rates of activity.
This continued growth could be for a few reasons. First, moving manufacturing away from China is expensive. According to the Bank of America, “Foreign firms looking to move their manufacturing processes outside of China in the wake of coronavirus could face $1 trillion in costs over five years.” Second, some of the legislative activities designed to motivate reshoring from China to the U.S., including the Reshoring American Manufacturing Act and new tax credits for companies that bring jobs from Chain back to the U.S., have stalled. Finally, China is experiencing its own economic recovery, which may be influencing local plants’ production of manufactured goods even for those with foreign ownership. The country’s economy expanded 3.2% from the previous year, making it the first major global economy to grow in 2020, according to the Wall Street Journal.
These three factors do not necessarily mean that moving manufacturing away from China is not going to happen or isn’t already in progress; however, we might not see the impact for several months or longer given the investment required.
Asia, Europe, North America data sets
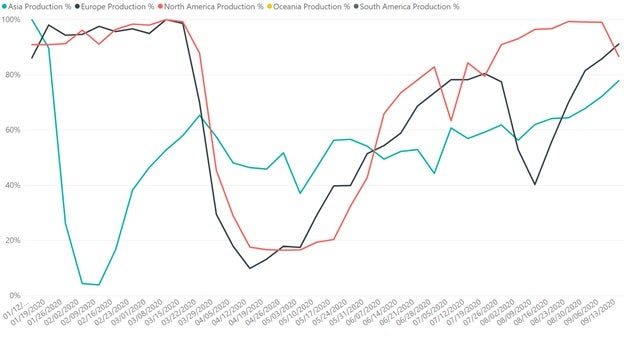
In part due to China’s strong production, Asia is seeing its highest rates of activity since February. Europe continues to ramp up production in August, following its annual holiday season. And, while North American production overall has been heavily impacted by the Labor/Labour Day holiday, what’s interesting to note is that excluding this holiday, all three regions have seen approximately four weeks of consistent growth, a trend that hasn’t happened since early May.
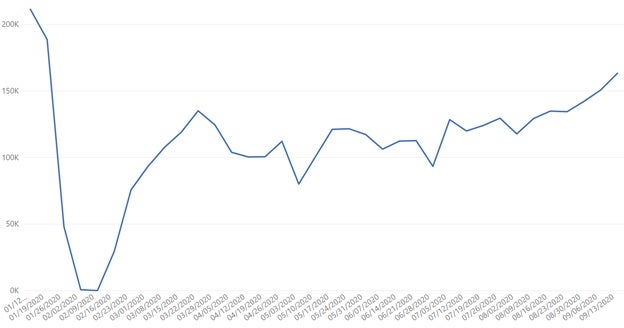
Mexico data set
Manufacturing production in Mexico is still exceeding pre-pandemic rates of activity. While activity has generally remained flat over the past two weeks, it’s likely that as the rest of North America comes back online following the Labor/Labour Day holiday, the country’s production will similarly increase.
Employment Trends
Unique users v. production percentage data set
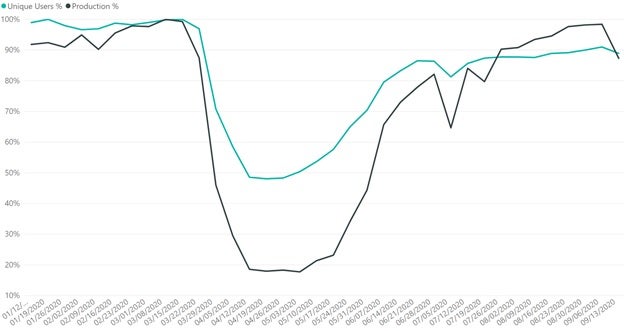
The above chart compares unique users logging into the company’s manufacturing system of record/engagement per week against peak pre-COVID levels, in green, against peak pre-COVID manufacturing production activity, in black. The week prior to Labor/Labour Day, employment was at 90% of pre-COVID rates of activity, while production reached 98.4%. And while production fell to 87% last week, unique users logging in remained fairly level at 89%. Given that logins have been largely consistent over the past several weeks, despite swings in production activity, manufacturers are demonstrating they can produce at higher levels without showing extreme shifts in their workforce volume.
A Look Ahead
Despite holiday-related drops in activity, we anticipate that U.S. and Canadian manufacturers will continue to reach toward 100% pre-pandemic rates of production in the weeks ahead, which could positively affect production in Mexico. As trade rules and discussions between China and the U.S. continue to be scrutinized, it will be interesting to see if production in China will be impacted, or how the U.S. election in November impacts the global manufacturing community.
Details on the Data Source & How to Interpret Graphs
Plex Systems solutions are cloud-based, giving us access to 20 years of anonymized, compiled operational data from the approximately 700 manufacturers we serve. This group collectively runs 1,200 active production facilities in 29 countries, representing the aerospace, automotive, fabricated metals, food and beverage, industrial machinery, and plastics and rubber industries. For scale, in the fourth quarter of 2019 alone, this group together processed over 1.4 million shipments. Daily, they record upwards of 8 billion transactions (such as barcode scans, moved inventory, shipments, etc.). Note this data reflects production transactions from January 1, 2020 to September 13, 2020. There is a margin of error of +/- 2%.
About the Author
Jerry Foster Chief Technology Officer, Plex Systems
Jerry Foster is CTO and leads our technology strategy, along with research and design initiatives focused on next-generation cloud solutions for the manufacturing enterprise. A founding member of the Plex team, Jerry has been instrumental in the entire evolution of Plex, overseeing the technical transitions in each phase of our growth. Jerry earned his degree in Computer Science at Liberty University.