

Announcement

Now Available!
Get your copy of the 7th Annual State of Smart Manufacturing and hear from 300+ manufacturers in this new survey report!
Subscribe to Our Blog
For a monthly digest of expert insights, data points, and tips like the ones in this article.
COVID-19 Update: Top Four Things to Know about Manufacturing Production This Week
Big Data, Cloud ERP Technology, Manufacturing Intelligence, COVID-19 (Coronavirus)
May 13, 2020

This week’s unique manufacturing data shows an upward trend in activity, with many regions and industries around the world showing signs of increased production. It is a hopeful sign as COVID-19-related restrictions continue to lift globally and manufacturers restart operations safely.
Here are the top four important things you should know about manufacturing production activity this week. For access to more stories from individual manufacturers who are responding to COVID-19 with agility, join our virtual conference PowerPlex, May 12-14 at www.PowerPlex.com.
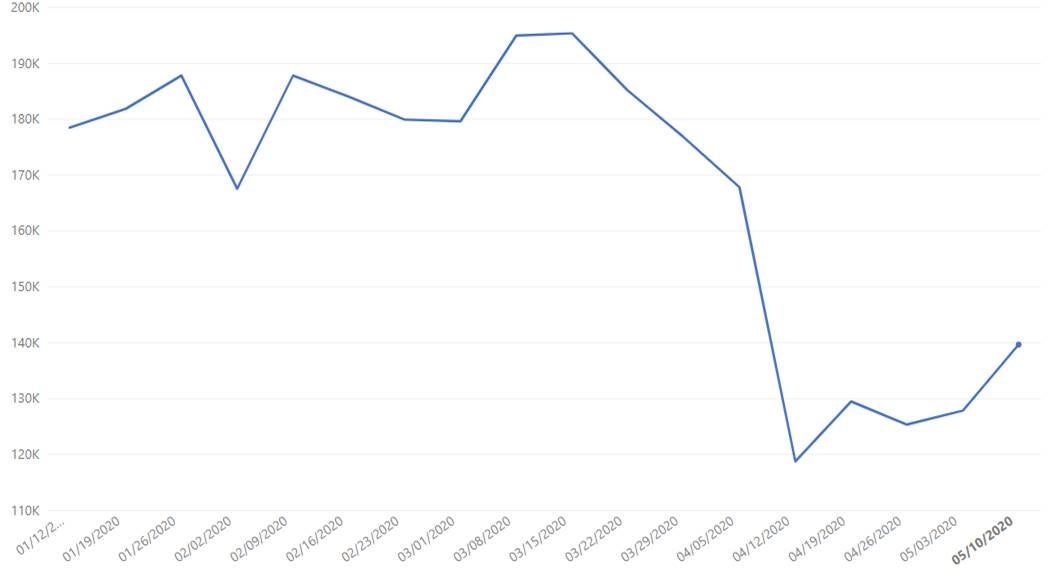
Global manufacturing is increasing.
Since the week of April 13, manufacturing production activity has picked up almost 15%, with nearly every industry Plex is watching experiencing some growth.
Global data set
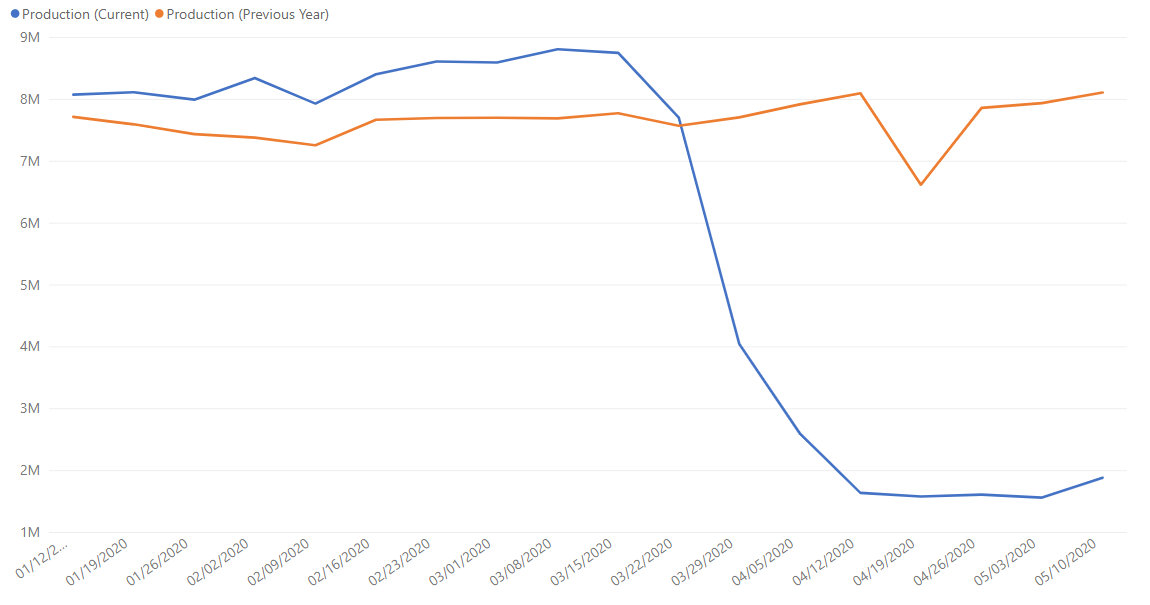
Food and beverage manufacturers are approaching pre-COVID-19 levels of activity.
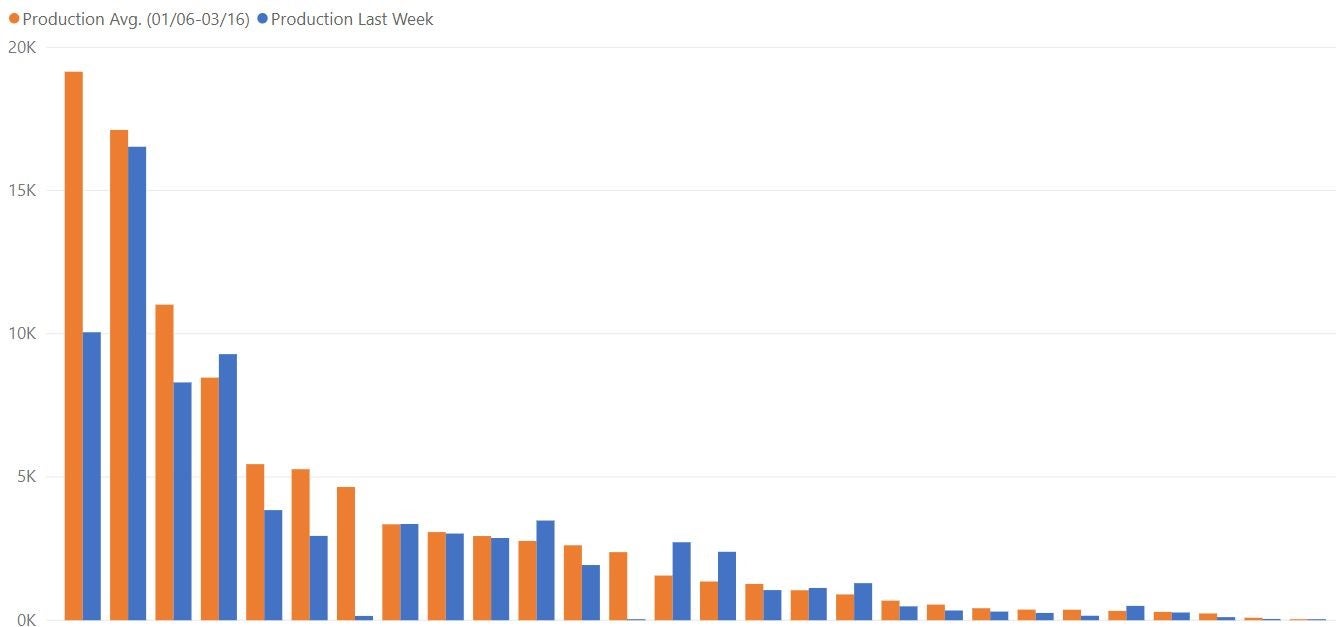
Overall, food and beverage manufacturers in the Plex community are moving toward pre-pandemic levels of production. When we look at individual companies, however, we see two distinct experiences: those that are meeting or even exceeding pre-COVID-19 production levels and those that remain (sometimes significantly) behind. While we have anonymized the data in the bar chart below, we know that individual frozen food co-packers, commercial bakeries, and companies that have been able to pivot their production to serve the demand for products like hand sanitizer are producing at levels seen prior to the pandemic. In some cases, these specific companies are even exceeding those levels. Companies that serve grocery store chains, for instance, are seeing huge surges in demand, with factories that produce foods like frozen pizza running nearly non-stop as a result. On the other end of the spectrum, manufacturers that primarily or only serve the restaurant industry are not faring as well. In California, the L.A. Times reports that when the governor asked restaurants to close – an order that was also given in other U.S. states and countries around the world – “food service industry, which supplies restaurants and bars, as well as schools, hotels, production studios and catering services, immediately tanked.”
Global food & beverage manufacturing data set (2020)
Anonymized indiviudual food & beverage manufacturing data set (this chart compares the average of pre-pandemic production output with production output in the last week)
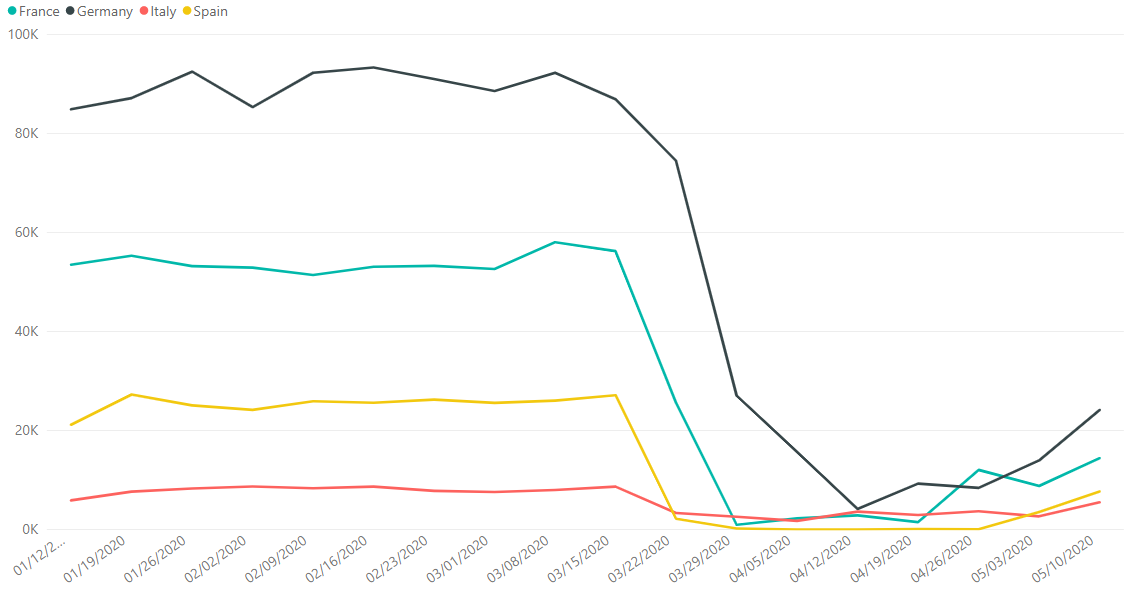
Manufacturing in Europe is up across the board.
After a few weeks of inconsistent manufacturing production, France, Germany, Italy, and Spain have all seen increased productivity in the last week. This may be a sign of increased growth in weeks to come, though some European countries, similar to the broader global manufacturing community, are still far from pre-pandemic levels.
France, Germany, Italy, Spain 2020 data set
The global automotive industry has begun its phased reopening.
As reported in our blog posts over the last few weeks, automakers around the world are restarting operations. Last week, French automaker PSA (which produces vehicles under the Peugeot, Citroen, Opel and Vauxhall brands) and Honda began to open non-U.S. sites. In Michigan, a major hub for automotive OEMs such as Ford and General Motors and their suppliers, hundreds of thousands of workers head back to work this week.
Global automotive data set
What’s Next?
After a few weeks of inconsistent production output, it is fair to expect that manufacturing production could begin to see longer periods of steady growth in the weeks ahead. With major automotive manufacturers restarting operations, their extensive global supply chains are likely not far behind, meaning those that serve the automotive industry have the most potential for dramatic growth in the coming weeks. And as local businesses, including restaurants, reopen in phases, we expect that food and beverage manufacturers will experience greater demand and we will continue to see increased activity as a result.
Details on the Data Source & How to Interpret Graphs
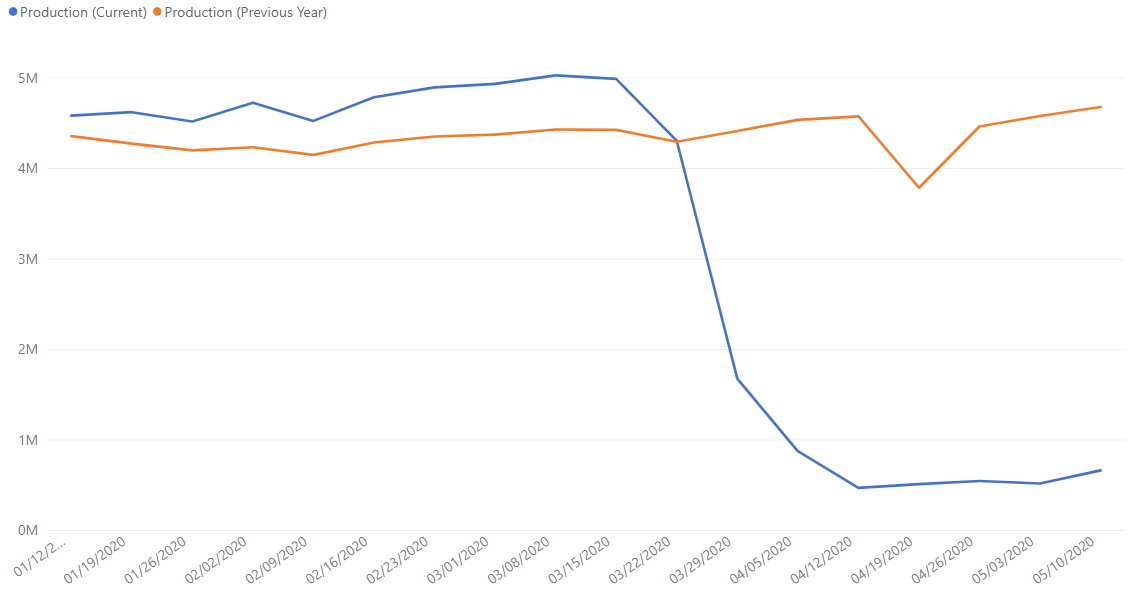
Plex Systems solutions are cloud-based, giving us access to 20 years of anonymized, compiled operational data from the approximately 700 manufacturers we serve. This group collectively runs 1,200 active production facilities in 29 countries, representing the aerospace, automotive, fabricated metals, food and beverage, industrial machinery, and plastics and rubber industries. For scale, in the fourth quarter of 2019 alone, this group together processed over 1.4 million shipments. Daily, they record upwards of 8 billion transactions (such as barcode scans, moved inventory, shipments, etc.).
Note this data reflects two periods of production activity to compare year-over-year trends: the blue trend line is production transactions from January 1, 2020 to May 10, 2020 and the orange trend line indicates production transactions from January 1, 2019 to May 10, 2019 (see x-axis, with dates noting the end of the tracked week). Keep in mind that Plex customers added more facilities in 2020, so it’s not necessarily important to look at the absolute number of transactions (see Y-axis) but rather the relative shape of the curves year-over-year. Login data reflects activity from January 1, 2020 to April 26, 2020. There is a margin of error of +/- 2%.
A note on April data: Most graphs above indicate a steep drop in activity in April in 2019. This decrease indicates the annual drop in production around the Easter holiday, including Good Friday. You’ll note this did not occur as dramatically in 2020, likely due to most production activity already being at rates considered essential.
About the Author
Jerry Foster Chief Technology Officer, Plex Systems
Jerry Foster is CTO and leads our technology strategy, along with research and design initiatives focused on next-generation cloud solutions for the manufacturing enterprise. A founding member of the Plex team, Jerry has been instrumental in the entire evolution of Plex, overseeing the technical transitions in each phase of our growth. Jerry earned his degree in Computer Science at Liberty University.