

Announcement

Now Available!
Get your copy of the 7th Annual State of Smart Manufacturing and hear from 300+ manufacturers in this new survey report!
Subscribe to Our Blog
For a monthly digest of expert insights, data points, and tips like the ones in this article.
Global Manufacturing Community at 102% of Pre-Pandemic Rates of Activity
Big Data, Cloud ERP Technology, COVID-19 (Coronavirus), Enterprise Resource Planning (ERP), Manufacturing Intelligence
October 1, 2020
Global manufacturing data set
Global manufacturers have exceeded pre-COVID-19 rates of activity, producing at a rate not seen since early March. Mexico, which realized 108% of peak pre-COVID rates of activity, and the automotive industry, which is producing at 102% today compared to early March, both contributed to this expansion. Canada also realized significant growth and is now at 92% of pre-pandemic rates of production. Despite overall growth globally, Europe, the U.S., and China all experienced slight drops locally week over week.
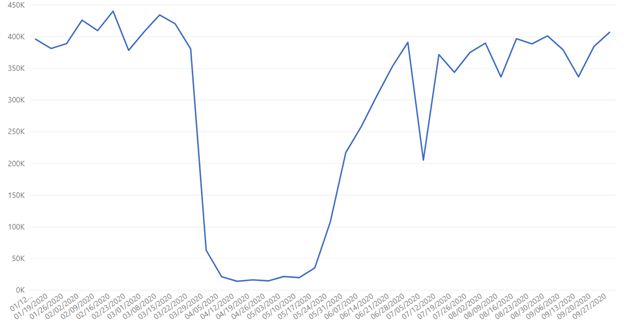
Mexico data set
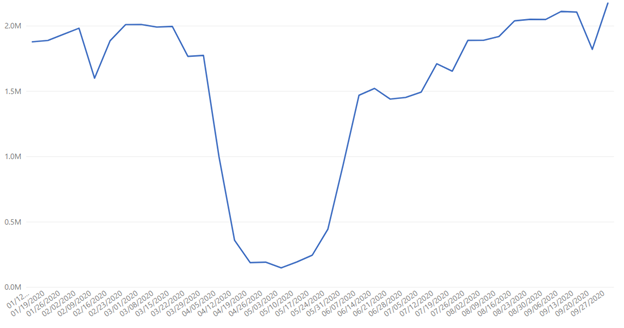
Following the country’s Independence Day celebration, activity in Mexico has ramped back up, growing 20% in the last week. Based on recent research from Bank of America, it’s possible that these numbers could continue to grow given that Mexico stands to benefit from U.S.-China trade and tech wars: “Mexico offers direct access to US markets, few or no tariffs, established supply chains, fuller intellectual property rights and 26% lower labor costs than China. Mexico annually graduates the fifth-largest number of engineers in the world and its proximity to the US drives 65% savings in transportation costs and 75% faster shipping times.” Despite a positive outlook for the country, the realization of this opportunity will depend on the country’s ability to overcome its weaknesses, which include trade policies, military involvement in customers, and energy privatization which could impact the cost of manufacturing locally, according to a recent interview in Supply Chain Brain.
Automotive data set
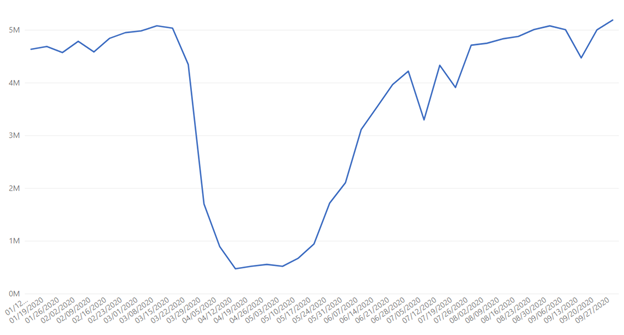
The global automotive industry is still growing, according to a connected mobility analyst, and “needs to play catch-up to make sure upcoming vehicle launches and the introduction of new autonomous technologies and infotainment systems stay on roughly the same schedule as was originally planned.” Other positive signs for the automotive industry comes from Moody’s, which recently changed its outlook for the industry from negative to stable, given the automotive supply chain’s proven resiliency, and few disruptions following reopening efforts.
Canada data set
Manufacturing in Canada is once again growing, after seeing a short setback leading into and during the Labour Day holiday. The country is at the highest rate of production since the pandemic began affecting the region in late February. Signaling potential future growth in the region is a new labor contract between Ford Motor Co. of Canada and Canadian automakers, which is expected to bring $1.5 billion in investments to build battery-electric vehicles in Canada. And according to the CME Economics, employment in the manufacturing sector rose for the fourth consecutive month in August, up by 29,400, bringing the industry close to recovering 75% of its pandemic-related job losses.
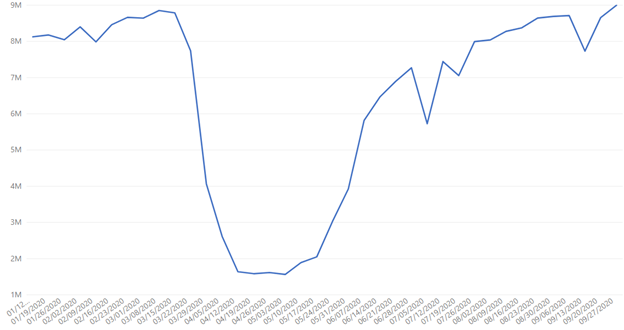
U.S. data set
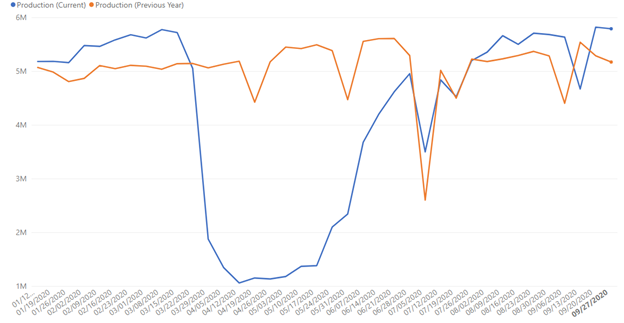
U.S. manufacturers saw a slight drop in activity last week, as anticipated following the post-Labor Day related boost in activity following the holiday slowdown (similar to the activity also seen in Canada). However, when 2020 (blue line, above) is compared to 2019 (orange line, above) it is clear the year-over-year drop is less significant in 2020. With manufacturing production recently exceeding expectations, as noted in last week's update, it’s possible that activity could remain steady in the weeks ahead.
China data set
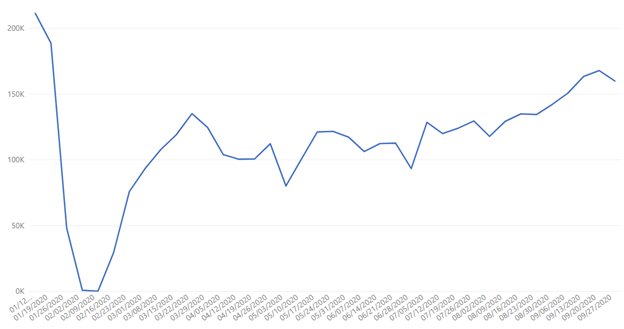
Despite China’s industrial profits growing for the fourth straight month, China is seeing its most significant decline in activity since mid-July. It could be possible that the country is starting to see some market correction after a brief catch-up period, as another survey notes that manufacturing growth is simply holding steady due to weaker orders from export markets.
Asia, Europe, and North America data set
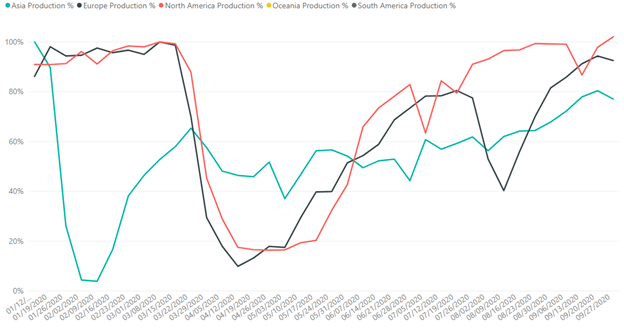
Europe saw another decline this week after nearly seven weeks of consecutive growth, despite a positive Manufacturing PMI September 1 that noted a second month of improved conditions. The same report predicted “near-term weakening of demand,” which we could be seeing in near-real time here as September comes to a close.
Unique users v. production % data set
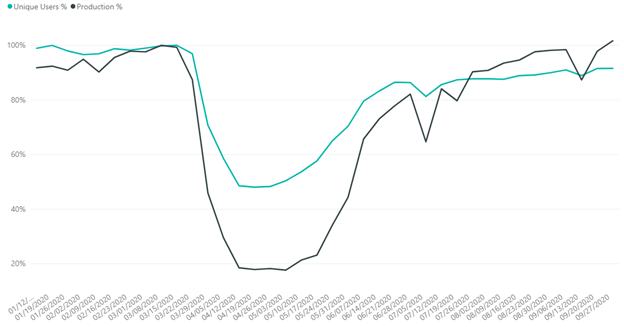
The above chart compares unique users logging into the company’s manufacturing system of record/engagement per week against peak pre-COVID levels, in green, against peak pre-COVID manufacturing production activity, in black. Since late July, production has grown from 80% pre-COVID rates of production to 101%, while unique users have grown from just 87% to 92% during that same period. This reinforces that despite swings in production activity, manufacturers are demonstrating they can produce at higher levels without showing similarly extreme shifts in their workforce volume.
A Look Ahead
While there are several positive signs coming from specific regions and industries, as well as analysts and experts, we caution that the manufacturing industry shouldn’t be considered “recovered” from the effects of the pandemic. Instead, this data should be seen as another proof point that the manufacturing community as a whole is experiencing a gradual, if bumpy, recovery and may have reason to be more optimistic heading into the fourth quarter than originally predicted.
Details on the Data Source & How to Interpret Graphs
Plex Systems solutions are cloud-based, giving us access to 20 years of anonymized, compiled operational data from the approximately 700 manufacturers we serve. This group collectively runs 1,200 active production facilities in 29 countries, representing the aerospace, automotive, fabricated metals, food and beverage, industrial machinery, and plastics and rubber industries. For scale, in the fourth quarter of 2019 alone, this group together processed over 1.4 million shipments. Daily, they record upwards of 8 billion transactions (such as barcode scans, moved inventory, shipments, etc.). Note this data reflects production transactions from January 1, 2020 to September 27, 2020. There is a margin of error of +/- 2%.
About the Author
Jerry Foster Chief Technology Officer, Plex Systems
Jerry Foster is CTO and leads our technology strategy, along with research and design initiatives focused on next-generation cloud solutions for the manufacturing enterprise. A founding member of the Plex team, Jerry has been instrumental in the entire evolution of Plex, overseeing the technical transitions in each phase of our growth. Jerry earned his degree in Computer Science at Liberty University.