

Announcement

Now Available!
Get your copy of the 7th Annual State of Smart Manufacturing and hear from 300+ manufacturers in this new survey report!
Subscribe to Our Blog
For a monthly digest of expert insights, data points, and tips like the ones in this article.
U.S. Manufacturers Exceed Pre-Pandemic Levels of Production Activity
Big Data, Cloud ERP Technology, COVID-19 (Coronavirus), Manufacturing Intelligence
September 24, 2020
The U.S. manufacturing industry reached a significant milestone last week as manufacturers surpassed pre-COVID-19 rates of activity for the first time since the effects of the pandemic took hold in early March. Romania also exceeded its pre-pandemic rates of activity as of last week, while average activity in Europe continued to climb. China saw another week of growth as well, contributing to Asia’s continued recovery.
U.S. data set
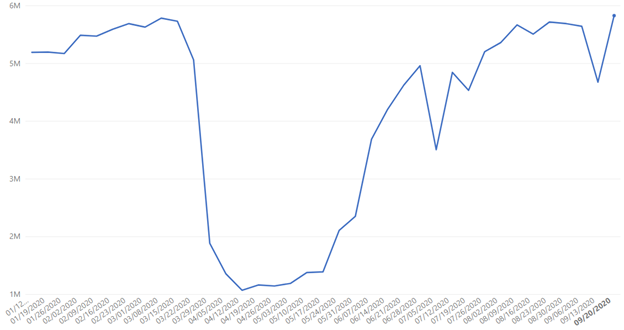
U.S. manufacturers demonstrated a significant spike in activity last week, quickly recovering from the Labor Day-driven drop in production the week prior. As of September 20, the U.S. is at 101% of pre-pandemic production rates. Should the region remain consistent with year-over-year trends, we may see a slight drop in activity again next week as the region settles post-holiday. A recent flash survey from IHS Markit showed that in September, the U.S. manufacturing PMI also grew more quickly than anticipated. However, that same survey shows that broadly, the U.S. economic recovery seems to be losing speed. Other reports indicate that the U.S. economy is showing signs of slowing as we head into the fourth quarter.
Romania data set
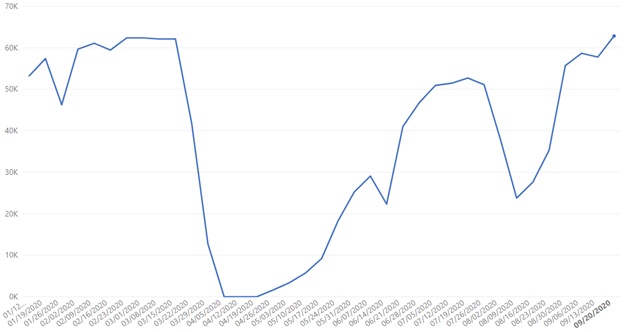
Similar to the U.S., Romania has achieved 101% of pre-pandemic rates of manufacturing production activity, largely driven by strong automotive industry activity.
China data set
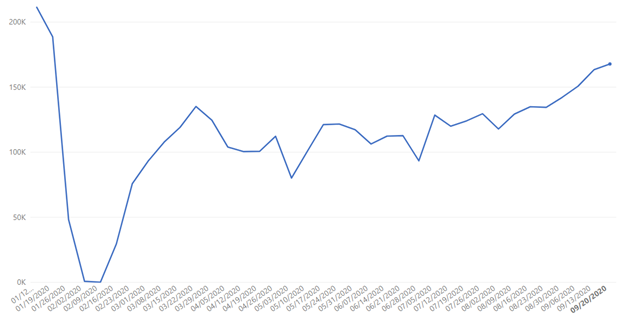
Chinese manufacturers have achieved four consecutive weeks of growth as of September 20. This recovery may continue for the foreseeable future, as noted in last week's update, given the combined effects of the country’s own strong economic recovery, and stalled legislation and financial realities that may be delaying efforts from U.S.-based companies to move manufacturing operations away from the region in order to reduce long-term supply chain risk.
Asia, Europe, and North America data set
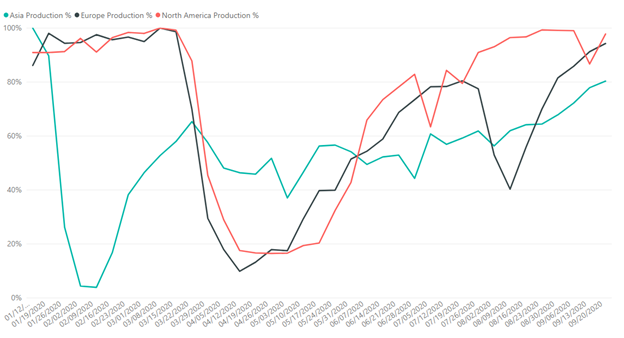
Increased manufacturing activity by companies in the U.S., Romania and China has positively influenced production in North America, Europe, and Asia respectively. North America is now at 98% of pre-pandemic rates of production while Europe is at 94% and Asia is at 80%. Europe’s growth can also be partially attributed to increased activity last week in both Germany and France.
Looking Ahead
It’s possible that activity in North America will exceed 100% of pre-COVID rates of activity in the coming weeks given that Mexico experienced a slight drop in activity this week as local manufacturers recognized the country’s Independence Day, and Canada increases production following the Labour Day holiday. While manufacturing activity within specific European countries remains somewhat inconsistent week over week, most regions are slowing trending upward, indicating that Europe may not be far behind North America in exceeding pre-pandemic rates of activity.
Details on the Data Source & How to Interpret Graphs
Plex Systems solutions are cloud-based, giving us access to 20 years of anonymized, compiled operational data from the approximately 700 manufacturers we serve. This group collectively runs 1,200 active production facilities in 29 countries, representing the aerospace, automotive, fabricated metals, food and beverage, industrial machinery, and plastics and rubber industries. For scale, in the fourth quarter of 2019 alone, this group together processed over 1.4 million shipments. Daily, they record upwards of 8 billion transactions (such as barcode scans, moved inventory, shipments, etc.). Note this data reflects production transactions from January 1, 2020 to September 20, 2020. There is a margin of error of +/- 2%.
About the Author
Jerry Foster Chief Technology Officer, Plex Systems
Jerry Foster is CTO and leads our technology strategy, along with research and design initiatives focused on next-generation cloud solutions for the manufacturing enterprise. A founding member of the Plex team, Jerry has been instrumental in the entire evolution of Plex, overseeing the technical transitions in each phase of our growth. Jerry earned his degree in Computer Science at Liberty University.