

Announcement

Now Available!
Get your copy of the 7th Annual State of Smart Manufacturing and hear from 300+ manufacturers in this new survey report!
Subscribe to Our Blog
For a monthly digest of expert insights, data points, and tips like the ones in this article.
Global Manufacturing Community Activity Diverges from China Recovery Model
COVID-19 (Coronavirus), Big Data, Manufacturing Intelligence
April 15, 2020

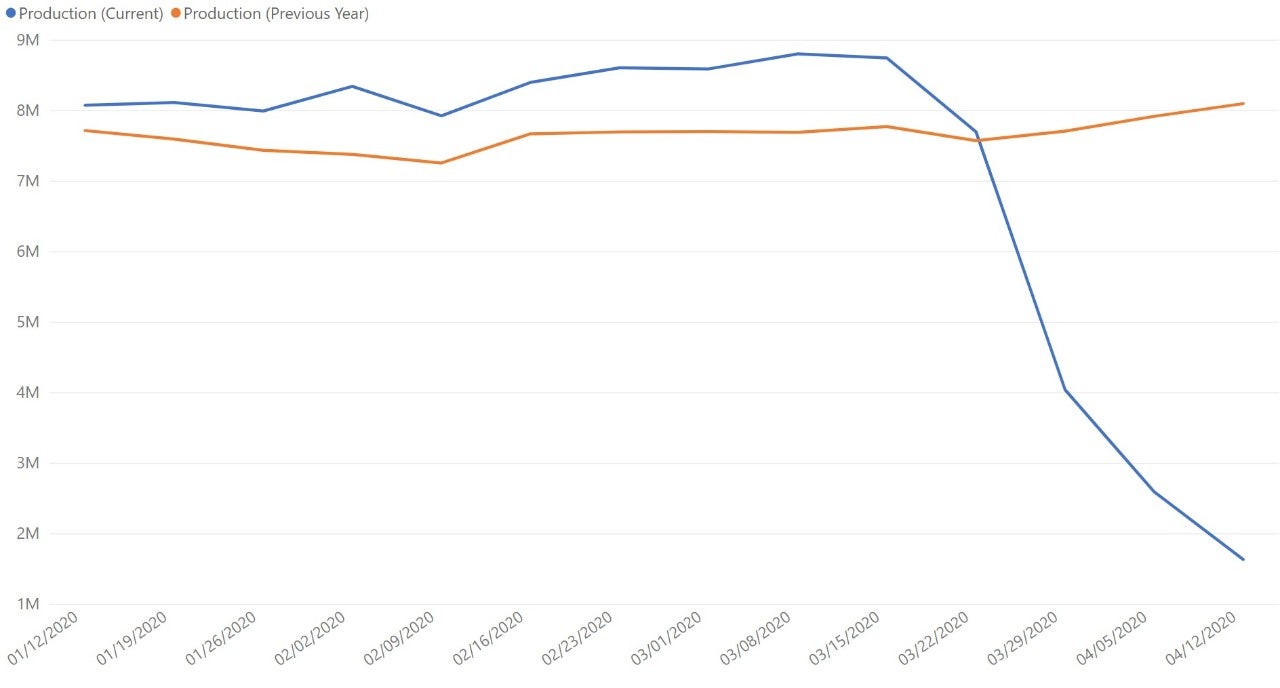
Global manufacturing activity continues to drop – now producing at approximately 20% of where rates were four weeks ago, when we saw the start of a steep decline in activity.
This trend is notable because it marks a divergence from the initial recovery model we saw established by China. China flattened out approximately three weeks from the start of its decline, spending a flat week at near-zero production before ramping up again. While the global community has somewhat slowed its decline (see below graph), we have yet to see a significant flattening.
This suggests that as a global community, more uncertainty lies ahead.
As mentioned in last week’s post, one potential outcome is that the U.S. in particular will face a slower recovery than China. This is corroborated by broader economic data from IHS Markit indicating in March that “…fears surrounding the longevity of shutdowns and the slow recovery thereafter led to the lowest degree of confidence since data collection for the series began in July of 2012.” Data and insights from ISM also indicate strongly negative near-term growth.
Global data set
Here are other significant changes indicated in this week’s data:
- U.S. food and beverage manufacturers are starting to see a decline in activity overall, but this isn’t necessarily a trend facing all companies. For instance, one of the private label bakeries that Plex supports was increasing activity over the last month before dropping significantly last week. Yet another bakery that we support is expected to increase production of sweet crackers ten-fold from its April production a year ago.
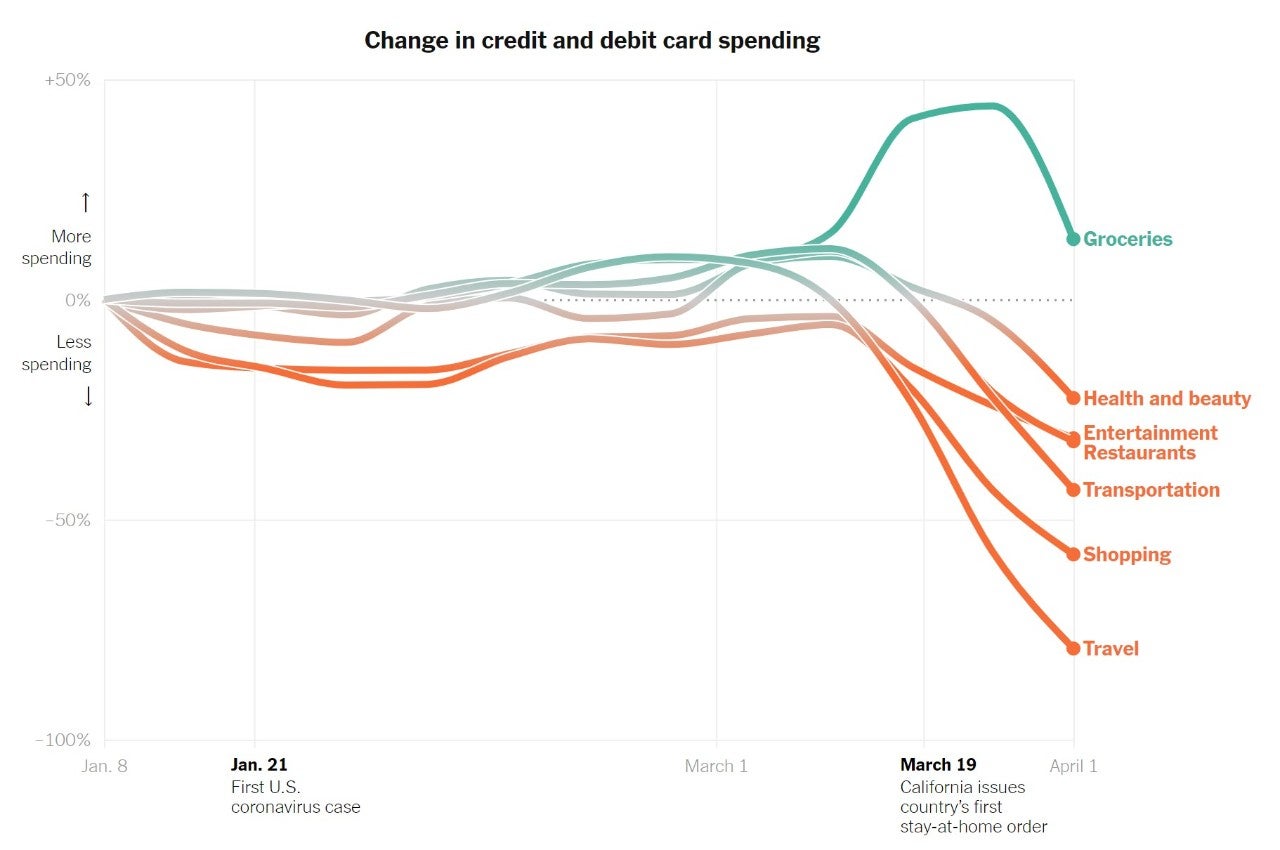
This could be reflective of their customers’ end-buyer: credit and debit card data released this week from Earnest Research showing purchasing behaviors in the U.S. indicates that grocery spending has spiked since lockdowns were enforced, while (and no surprise here) restaurant spending dropped (see graph below). This suggests that food and beverage manufacturers, while deemed essential by most local governments, might experience different recovery patterns as we emerge from the impact of COVID-19 based on whether they sell direct to grocery stores v. restaurants.
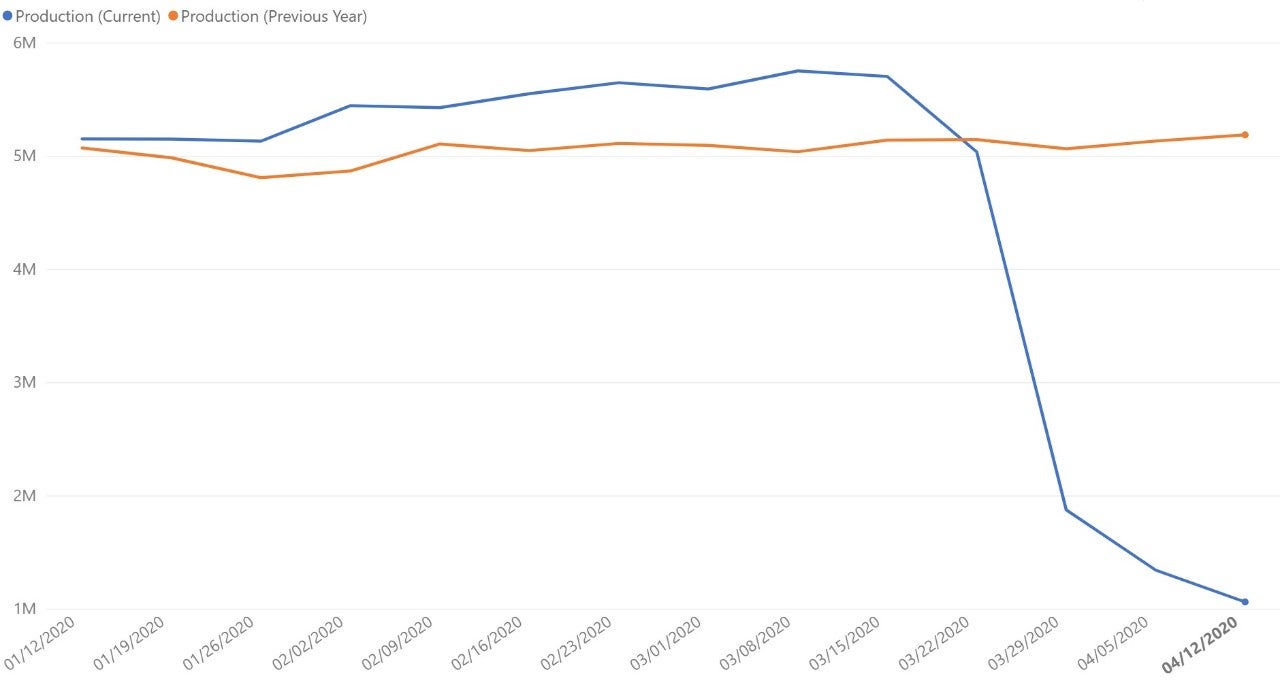
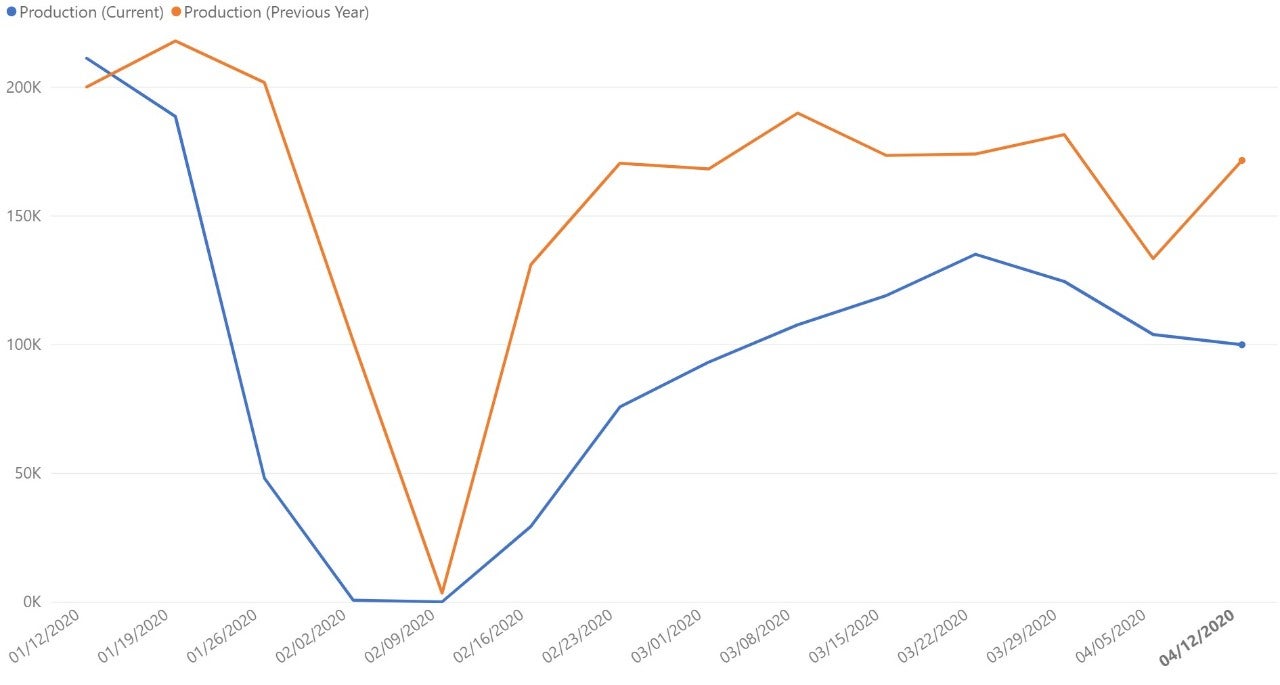
- China’s production remains in a state of decline, despite data from last year indicating that we should have seen a post-holiday spike in activity. This could reflect a troubled global supply chain that is holding off on making raw material purchases, given that manufacturers around the world are slowing or even halting production.
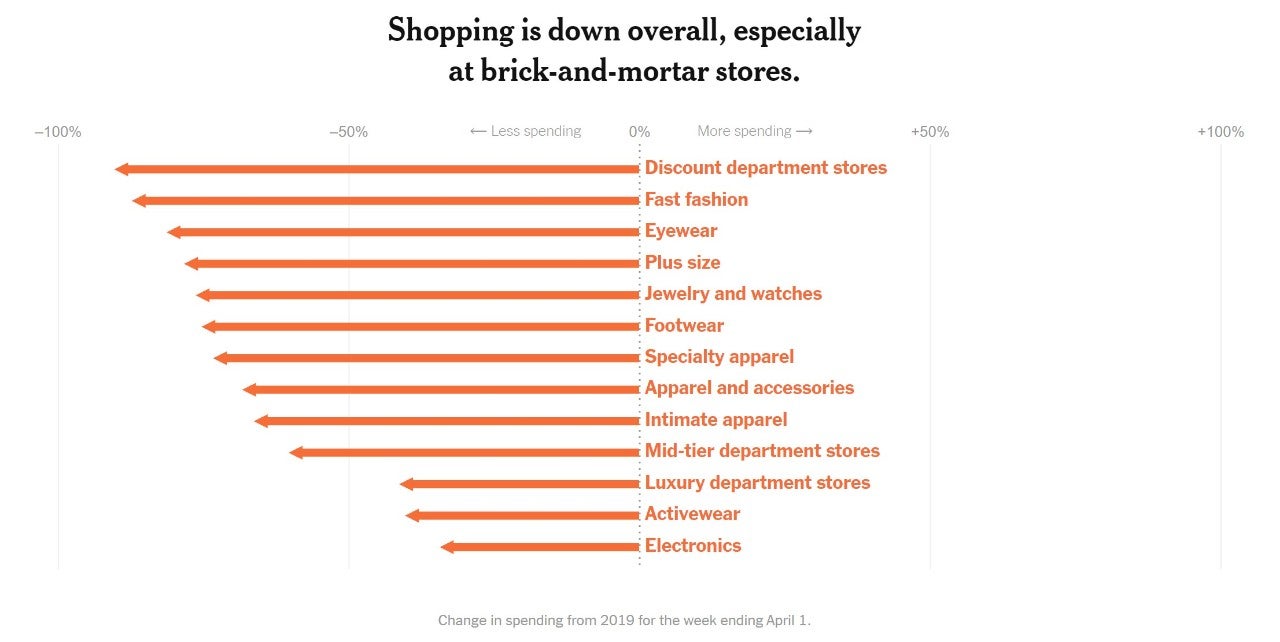
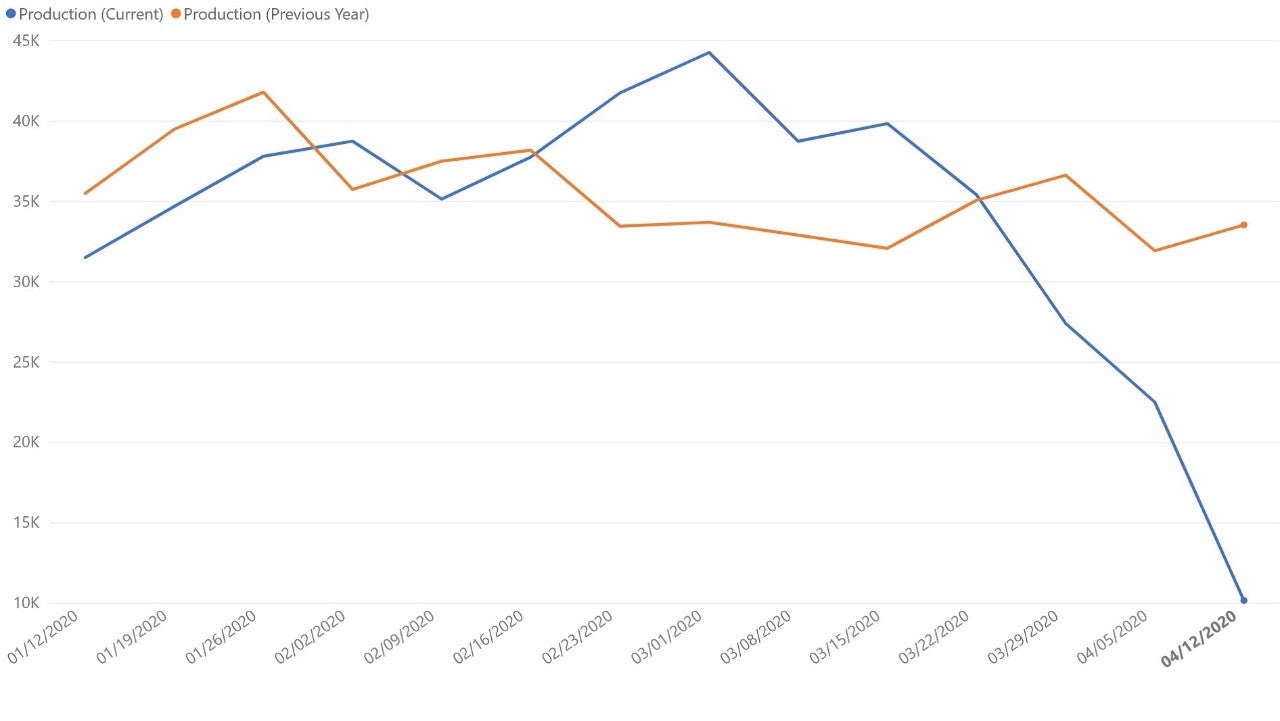
- Electronics manufacturers are experiencing a steep decline in activity, remaining in a near free-fall. While this is a relatively small data set, this could indicate a shift in buyer behavior. The same Earnest Research data mentioned above shows shopping for electronics and other goods are down, which could suggest manufacturers are starting to experience the implications of high unemployment rates, which are estimated to surpass those seen during the Great Recession.
The Bottom Line
This week’s global manufacturing production data shows that manufacturers continue to navigate uncharted territory. With the data showing China reaching bottom earlier in their model than the rest of the manufacturing community, it remains to be seen how much longer global production falls before following suit. We can only hope not much longer. In the meantime, newer models from other data sources – such as consumer buyer behavior – could help lend predictive insights into our collective future, and the behaviors of the manufacturers responsible for making the things we buy.
To hear directly from manufacturers who are finding ways to remain connected and ensure business continuity in a world where work environments are changing, supply chains are being disrupted, and uncertainty abounds, listen to this free webinar.
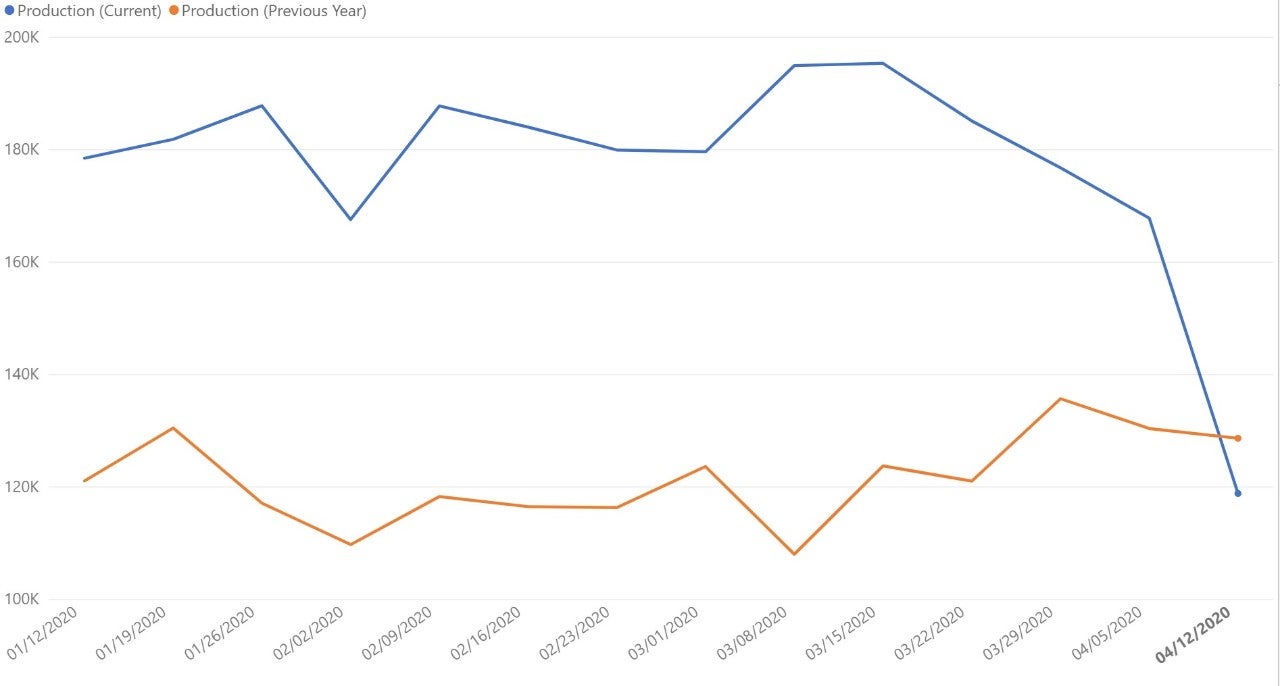
U.S. data set
U.S. food and beverage industry data set
China data set
Global electronics industry data set
Details on the Data Source & How to Interpret Graphs
Plex Systems solutions are cloud-based, giving us access to 20 years of anonymized, compiled operational data from the approximately 700 manufacturers we serve. This group collectively runs 1,200 active production facilities in 29 countries, representing the aerospace, automotive, fabricated metals, food and beverage, industrial machinery, and plastics and rubber industries. For scale, in the fourth quarter of 2019 alone, this group together processed over 1.4 million shipments. Daily, they record upwards of 8 billion transactions (such as barcode scans, moved inventory, shipments, etc.).
Note this data reflects two periods of production activity to compare year-over-year trends: the blue trend line is production transactions from January 1, 2020 to April 12, 2020 and the orange trend line indicates production transactions from January 1, 2019 to April 12, 2019 (see x-axis, with dates noting the end of the tracked week). Keep in mind that Plex customers added more facilities in 2020, so it’s not necessarily important to look at the absolute number of transactions (see Y-axis) but rather the relative shape of the curves year-over-year. There is a margin of error of +/- 2%.
About the Author
Jerry Foster Chief Technology Officer, Plex Systems
Jerry Foster is CTO and leads our technology strategy, along with research and design initiatives focused on next-generation cloud solutions for the manufacturing enterprise. A founding member of the Plex team, Jerry has been instrumental in the entire evolution of Plex, overseeing the technical transitions in each phase of our growth. Jerry earned his degree in Computer Science at Liberty University.