

Announcement

Now Available!
Get your copy of the 7th Annual State of Smart Manufacturing and hear from 300+ manufacturers in this new survey report!
Subscribe to Our Blog
For a monthly digest of expert insights, data points, and tips like the ones in this article.
Global Manufacturing Production at 91% of Pre-Pandemic Rates
Big Data, Cloud ERP Technology, COVID-19 (Coronavirus), Manufacturing Intelligence
August 6, 2020
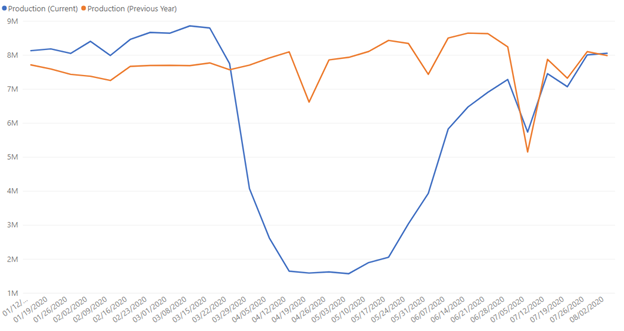
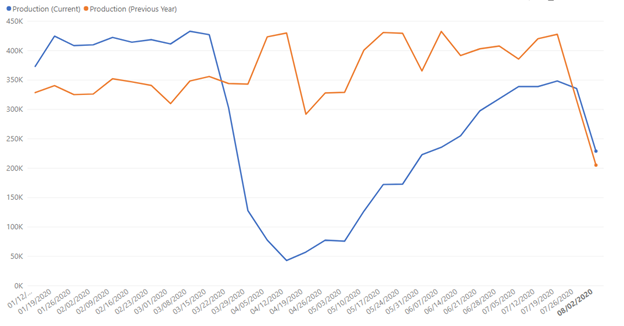
In the last two weeks, global manufacturing production has continued to climb, reaching 91% of pre-pandemic rates of activity as of August 2. As reported last month, activity in 2020 (indicated by blue line, below) continues to resemble trends seen in 2019 (see orange line, below). However, not all regions are experiencing the same rate of growth. A variety of different influencers are impacting the activity within plants in specific countries.
Global data set (blue line indicates 2020 activity; orange line indicates 2019 activity) Global worker login data set
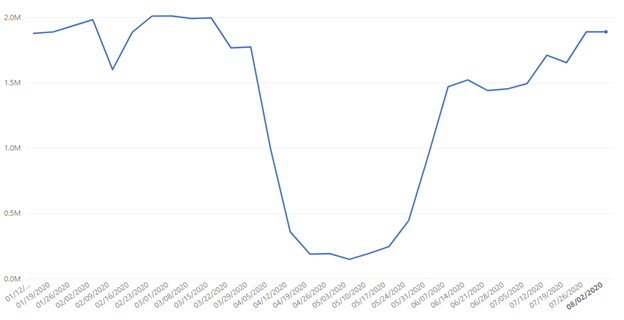
Global worker login data set
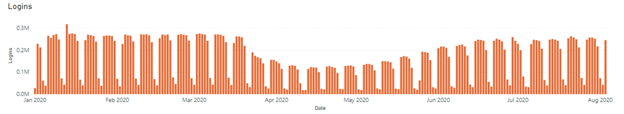
In addition to production activity, Plex also tracks daily worker login activity, which tracks the number of total logins within a 24-hour period – or, every time someone anywhere in the business logs into Plex to access, input, or manipulate information within Plex. In the last two weeks, logins on the plant floor have also continued to climb, peaking at 93% of pre-pandemic rates of activity. Since these are not unique logins this does not necessarily indicate that staffing at these facilities has returned to pre-pandemic levels, but it does indicate that more activity is taking place on the plant floor in line with production activity.
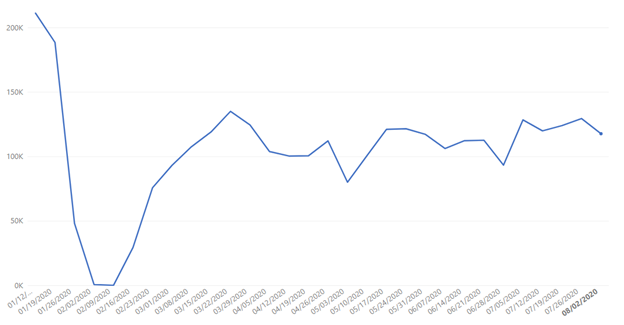
U.S. data set (note the early July drop indicates holiday slowdown)
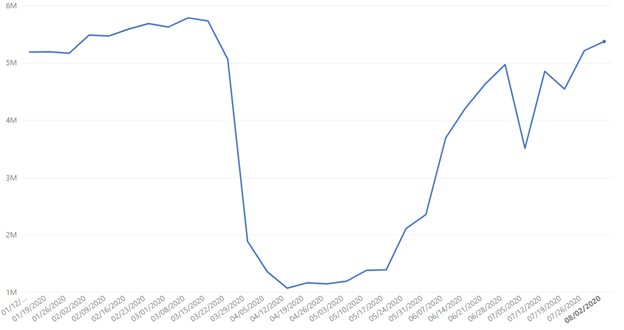
Growth in the U.S. is slightly higher than the global average, at 93% of pre-pandemic rates of activity. This continued growth comes on the heels of a report from ISM that U.S. manufacturing activity accelerated to its highest level in nearly 18 months in July as orders increased. However, experts warn that this growth could represent the market rebounding after widespread shutdowns and that with COVID-19 cases continuing to grow, businesses are likely to remain cautious. And while we continue to see logins steadily growing in line with activity at the global level, executives in the U.S. do not expect to hire moving forward, with the most recent employment index indicating that companies are still cutting jobs.
Europe data set (blue line indicates 2020 activity; orange line indicates 2019 activity)
Another sign of normalization within the manufacturing industry is the trend indicating that businesses in Europe are moving forward with their annual holiday season, which historically has slowed production activity. As indicated in the above chart, the 2020 decline in activity (see blue line) is nearly identical to 2019 activity (see orange line), even if the 2020 decline started from a lower point of production.
China data set
Activity in China remains volatile week-over-week, though activity appears to be steadily trending upward over the last five weeks. This week the Caixin/Markit manufacturing PMI for China indicated that the country’s manufacturing activity has expanded at the fastest pace in nearly a decade, though experts said overseas demand remains low, and policy stimulus has been one of the main drivers helping China recover.
Mexico data set
As Mexico continues to battle the outbreaks of the coronavirus, where the death toll is now the world’s third highest, manufacturing growth has flattened. While Mexico had nearly returned to near pre-COVID levels of activity, increasing cases of COVID-19 could reverse that trend in the future.
Looking ahead
As activity within manufacturing appears to be normalizing to year-over-year trends or even rebounding, it is unclear if this will continue given other market indicators. In the U.S., GDP saw its biggest quarterly plunge in history. And in China, while overall demand has increased, it has mostly grown due to policy-driven domestic demand.
As cases of COVID-19 continue to increase globally, we will continue to closely watch regions that are more impacted than others, such as Mexico and the U.S. While manufacturing activity in these regions has appeared to remain largely insulated from the direct effect of local outbreaks, any change in their future production could help illustrate how the global manufacturing community could respond to future waves or widespread outbreaks in the months ahead.
Details on the Data Source & How to Interpret Graphs
Plex Systems solutions are cloud-based, giving us access to 20 years of anonymized, compiled operational data from the approximately 700 manufacturers we serve. This group collectively runs 1,200 active production facilities in 29 countries, representing the aerospace, automotive, fabricated metals, food and beverage, industrial machinery, and plastics and rubber industries. For scale, in the fourth quarter of 2019 alone, this group together processed over 1.4 million shipments. Daily, they record upwards of 8 billion transactions (such as barcode scans, moved inventory, shipments, etc.). Note this data reflects production transactions from January 1, 2020 to August 2, 2020. There is a margin of error of +/- 2%.
About the Author
Jerry Foster Chief Technology Officer, Plex Systems
Jerry Foster is CTO and leads our technology strategy, along with research and design initiatives focused on next-generation cloud solutions for the manufacturing enterprise. A founding member of the Plex team, Jerry has been instrumental in the entire evolution of Plex, overseeing the technical transitions in each phase of our growth. Jerry earned his degree in Computer Science at Liberty University.