

Announcement
Now Available!
Get your copy of the 7th Annual State of Smart Manufacturing and hear from 300+ manufacturers in this new survey report!
Subscribe to Our Blog
For a monthly digest of expert insights, data points, and tips like the ones in this article.
May Manufacturing Data Shows Signs of Rebound
Big Data, Cloud ERP Technology, COVID-19 (Coronavirus), Manufacturing Intelligence
May 28, 2020
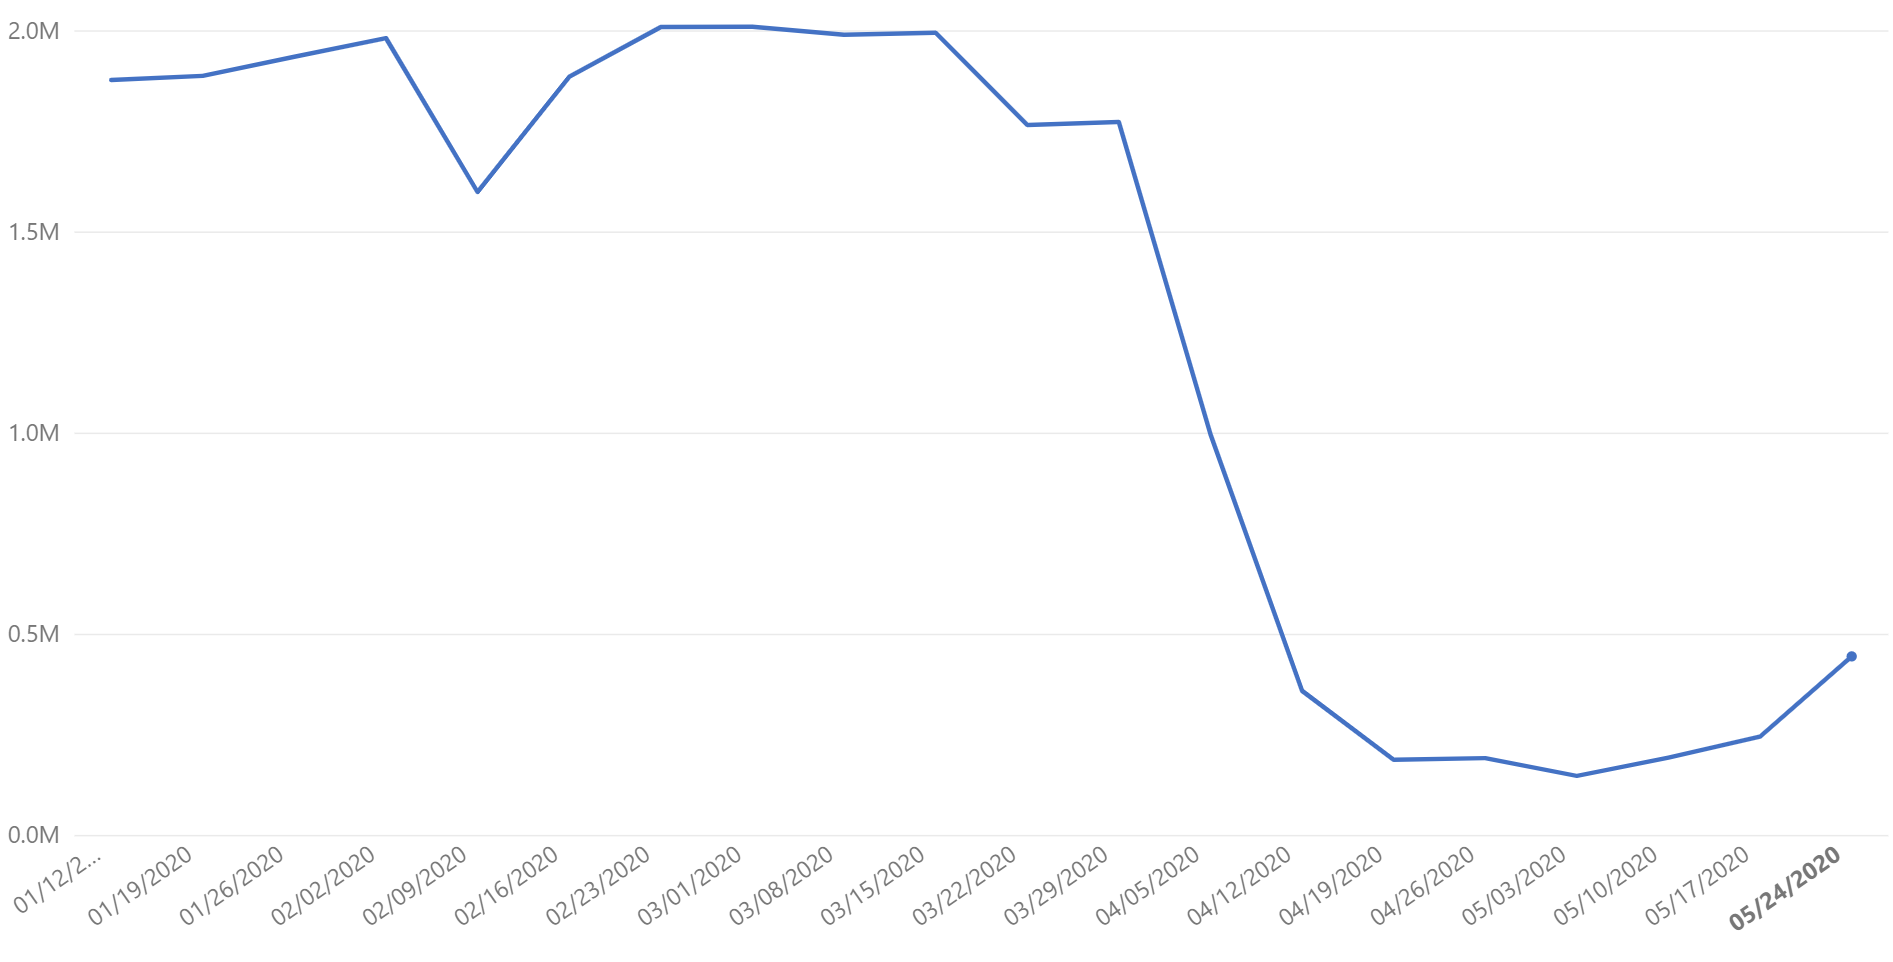
Global data set
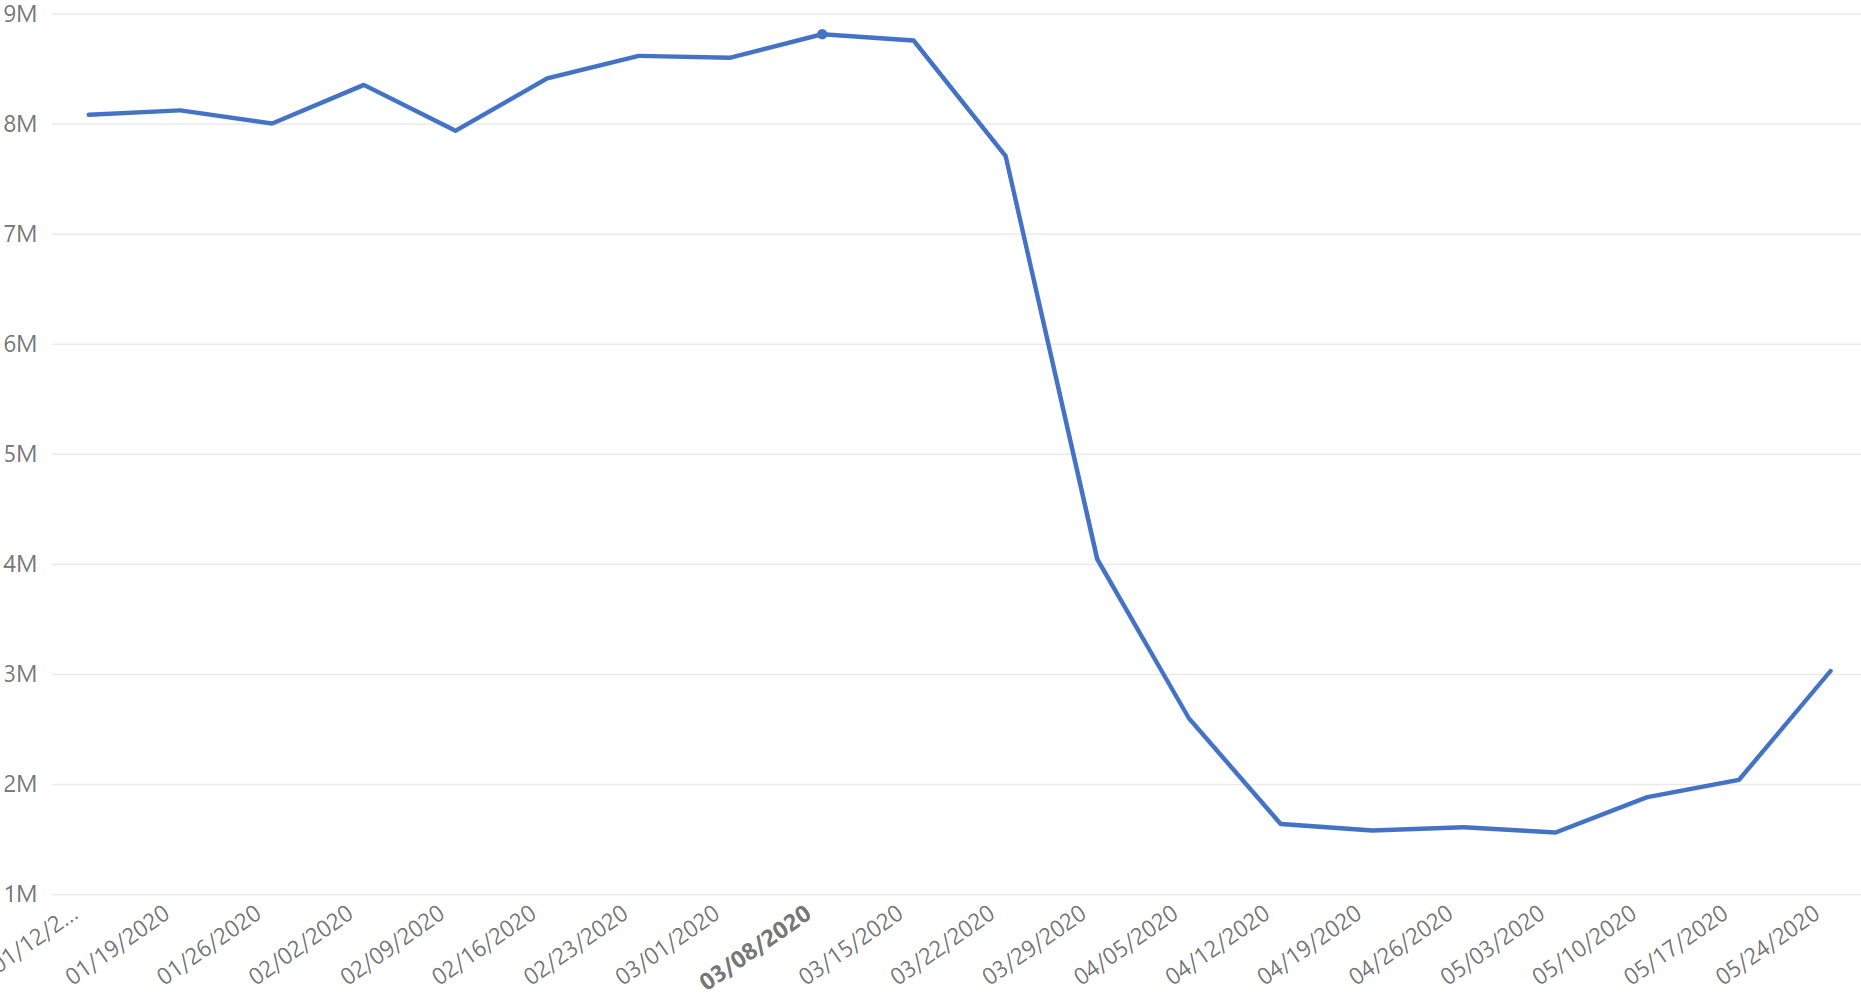
As we near the end of May, Plex’s unique COVID-19 related data suggests weeks of cautious optimism is warranted, as evidence of a rebound gains steam. Since the end of April, we’ve seen a four-week long streak of positive production activity.
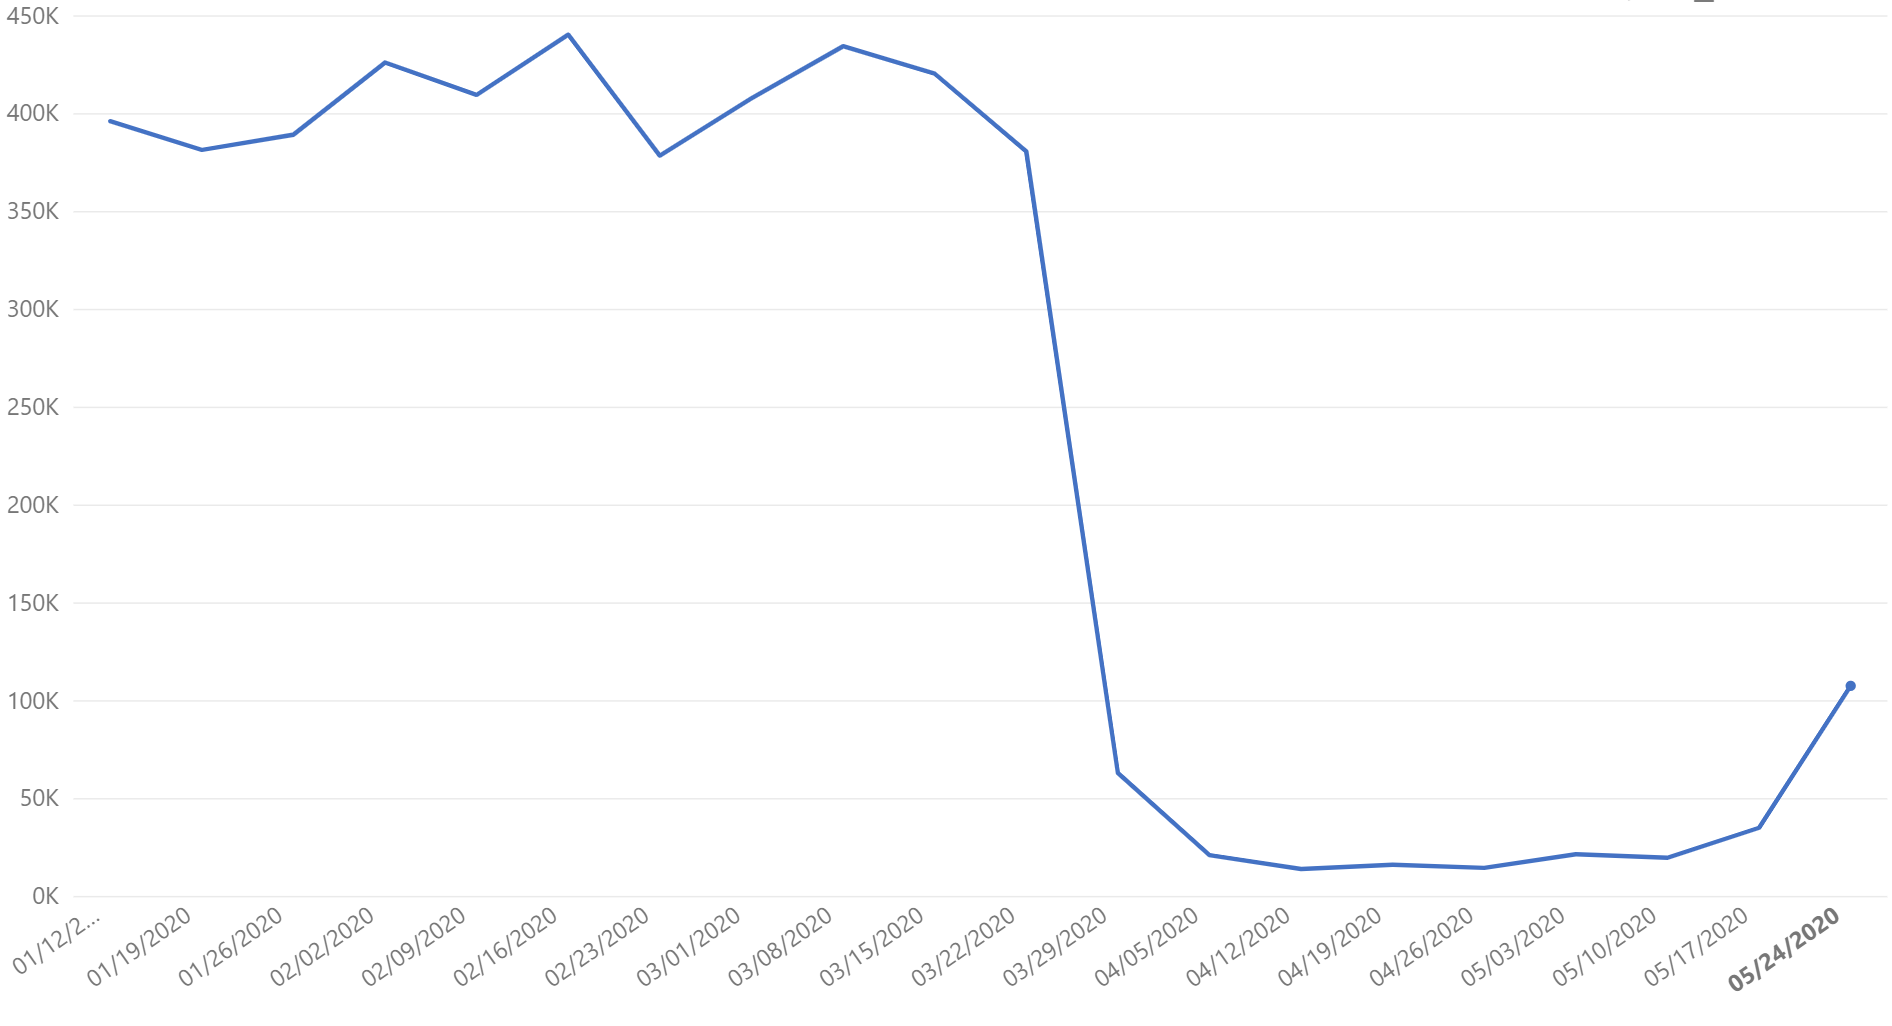
U.S. data set
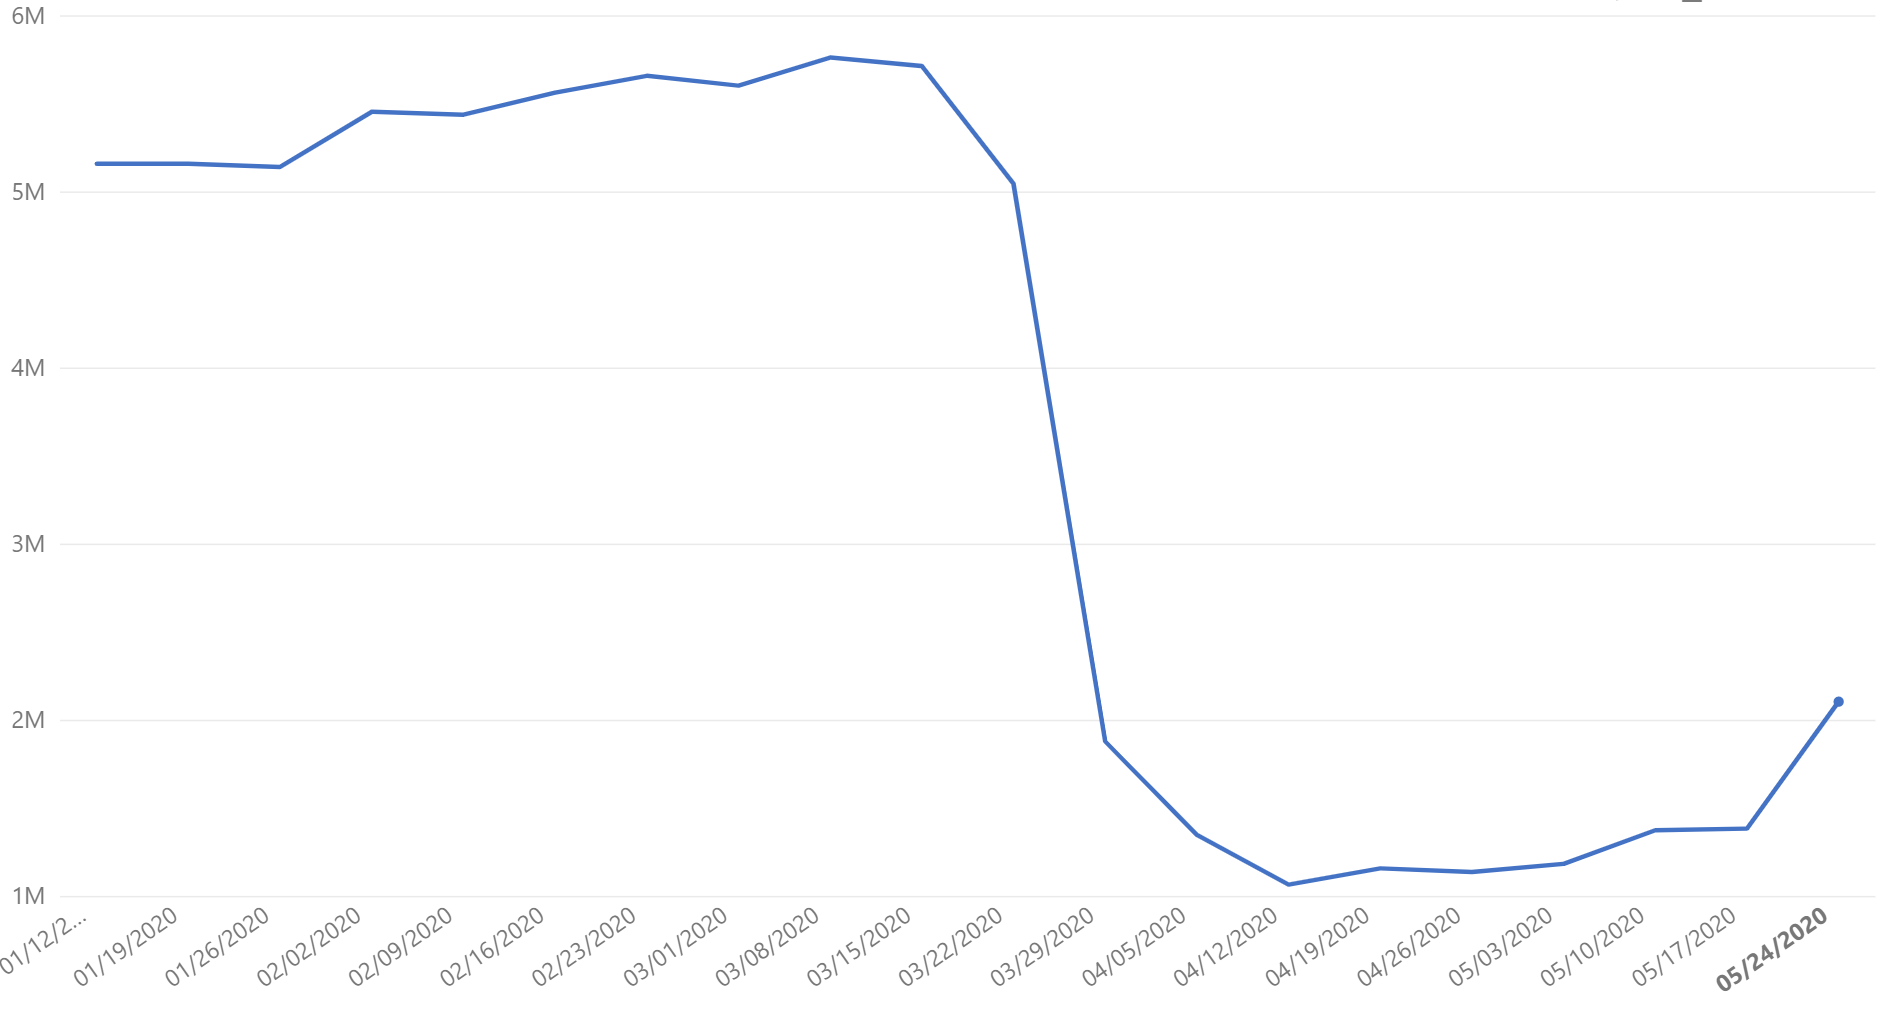
U.S. manufacturers are seeing a steady increase in activity over the last four weeks (and most dramatically, in the last week) after experiencing a Federal Reserve-reported slump in April that reduced overall industrial output by 11.2% month over month. American manufacturers increased production by 84% between the week of April 13th to the week of May 18th. Leading this resurgence are automotive suppliers, likely based on the news that many U.S.-headquartered automakers such as Ford, GM, and Tesla (along with U.S.-based plants from companies including FCA) are reopening. The efforts by OEMs have begun to reactivate their extensive global automotive supply chains, driving up overall U.S. production activity.
Other industries that saw a positive increase in U.S.-based production last week include aerospace and defense, which saw another 5% increase after seeing nearly 60% week-over-week growth globally last week. The electronics industry, which is a relatively small data set compared to the automotive and aerospace and defense industries, also saw 15% growth over the previous week. It is important to note that while progress in the last month has been positive, manufacturers are still producing at a rate far below those seen in late February/early March.
Mexico data set
Canada data set
Similar to the U.S., both Mexico and Canada are seeing several weeks of upward-trending activity in May. Our data indicates that like the U.S., growth in these two countries is largely due to increased activity coming from manufacturers serving the automotive industry. In Mexico, we expect to see continued growth in the weeks ahead based on media reports that GM reopened plants last week, with other automakers and suppliers, including Kia, FCA, and Lear Corp. restarting production this week. One consistent trend within these stories is that reopening efforts among all manufacturers are beginning with robust safety training on new health and safety protocols.
China data set
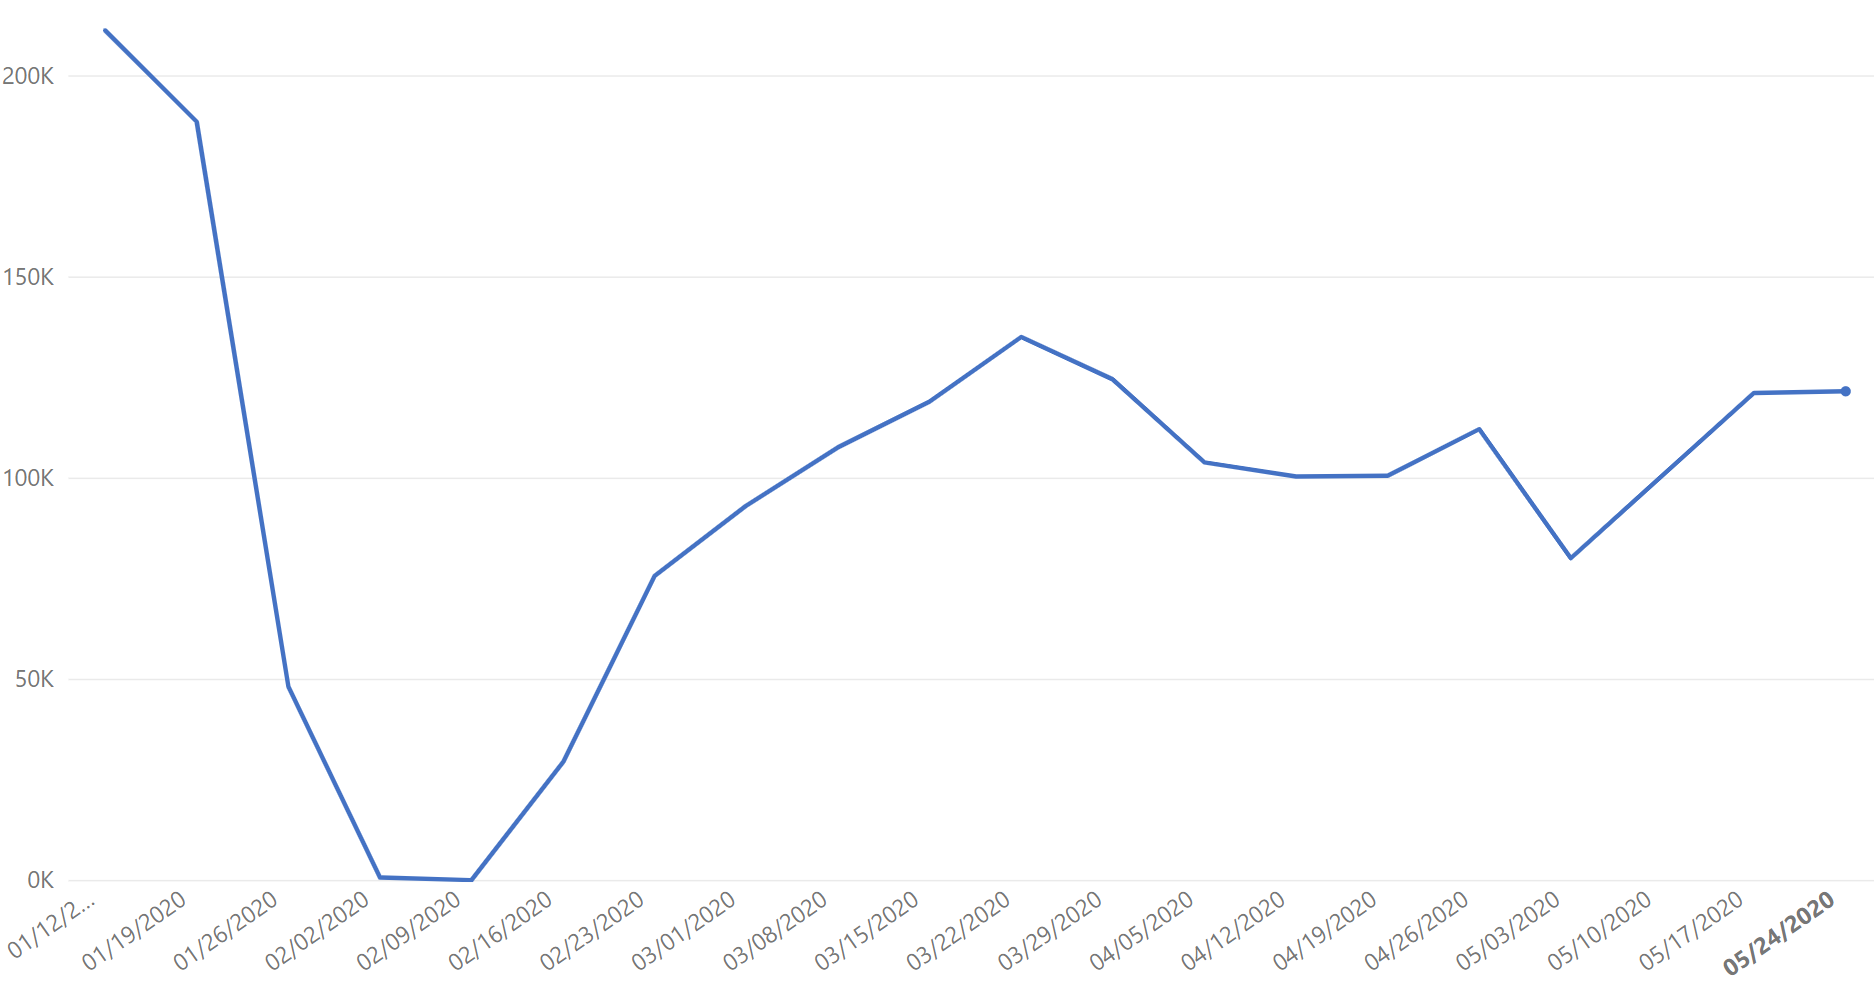
China Experiences Ongoing Disruption
China remains our earliest indicator of the future of the manufacturing industry since their first known cases of COVID19 were ahead of the rest of the world by 3-6 weeks. While the curves of the graph are significantly different at this stage of the recovery process than those seen in the U.S., Mexico, and Canada, it does hint toward the potential for a disruptive recovery pattern that specific regions or industries may experience in their ongoing recovery efforts. As we can see from the above graph, the efforts of Chinese manufacturers to return to pre-COVID-19 levels of activities, while optimistic in mid-March, have now plateaued. This trend could continue in the weeks and months ahead for Chinese companies as U.S. lawmakers begin to explore tax breaks, new rules, and subsidies that would incentivize reshoring efforts by U.S.-based companies.
Future Outlook: Prioritizing Workforce Safety Could be the Key to Recovery
It’s no surprise that similar to many states and countries, companies are communicating, preparing, and practicing safety protocols to protect the health of their employees as the first phase of their reopening efforts. With suppliers such as Lear publishing their own safe work playbook, and plants the world over restarting operations with a focus toward safety protocol, there seems to be a shared perspective that reducing the risk of illness needs to remain the priority to both protect the workers and to ensure business continuity. We’ve already seen that when a single employee tests positive for COVID-19, entire shifts may walk off the line or even entire plants may shut down, as demonstrated by the Ford Dearborn Truck Plant last week. With recovery efforts in the U.S. largely relying on state-by-state standards, it will be interesting to see if different patterns of recovery emerge based on differing workforce health and safety protocols and requirements.
Details on the Data Source & How to Interpret Graphs
Plex Systems solutions are cloud-based, giving us access to 20 years of anonymized, compiled operational data from the approximately 700 manufacturers we serve. This group collectively runs 1,200 active production facilities in 29 countries, representing the aerospace, automotive, fabricated metals, food and beverage, industrial machinery, and plastics and rubber industries. For scale, in the fourth quarter of 2019 alone, this group together processed over 1.4 million shipments. Daily, they record upwards of 8 billion transactions (such as barcode scans, moved inventory, shipments, etc.).
Note this data reflects production transactions from January 1, 2020 to May 24, 2020. There is a margin of error of +/- 2%.
About the Author
Jerry Foster Chief Technology Officer, Plex Systems
Jerry Foster is CTO and leads our technology strategy, along with research and design initiatives focused on next-generation cloud solutions for the manufacturing enterprise. A founding member of the Plex team, Jerry has been instrumental in the entire evolution of Plex, overseeing the technical transitions in each phase of our growth. Jerry earned his degree in Computer Science at Liberty University.