
Announcement

Now Available!
Get your copy of the 7th Annual State of Smart Manufacturing and hear from 300+ manufacturers in this new survey report!
Subscribe to Our Blog
For a monthly digest of expert insights, data points, and tips like the ones in this article.
Global Manufacturing Production Continues to Increase, North America Leads the Way
COVID-19 (Coronavirus), Big Data, Cloud ERP Technology, Manufacturing Intelligence
June 10, 2020

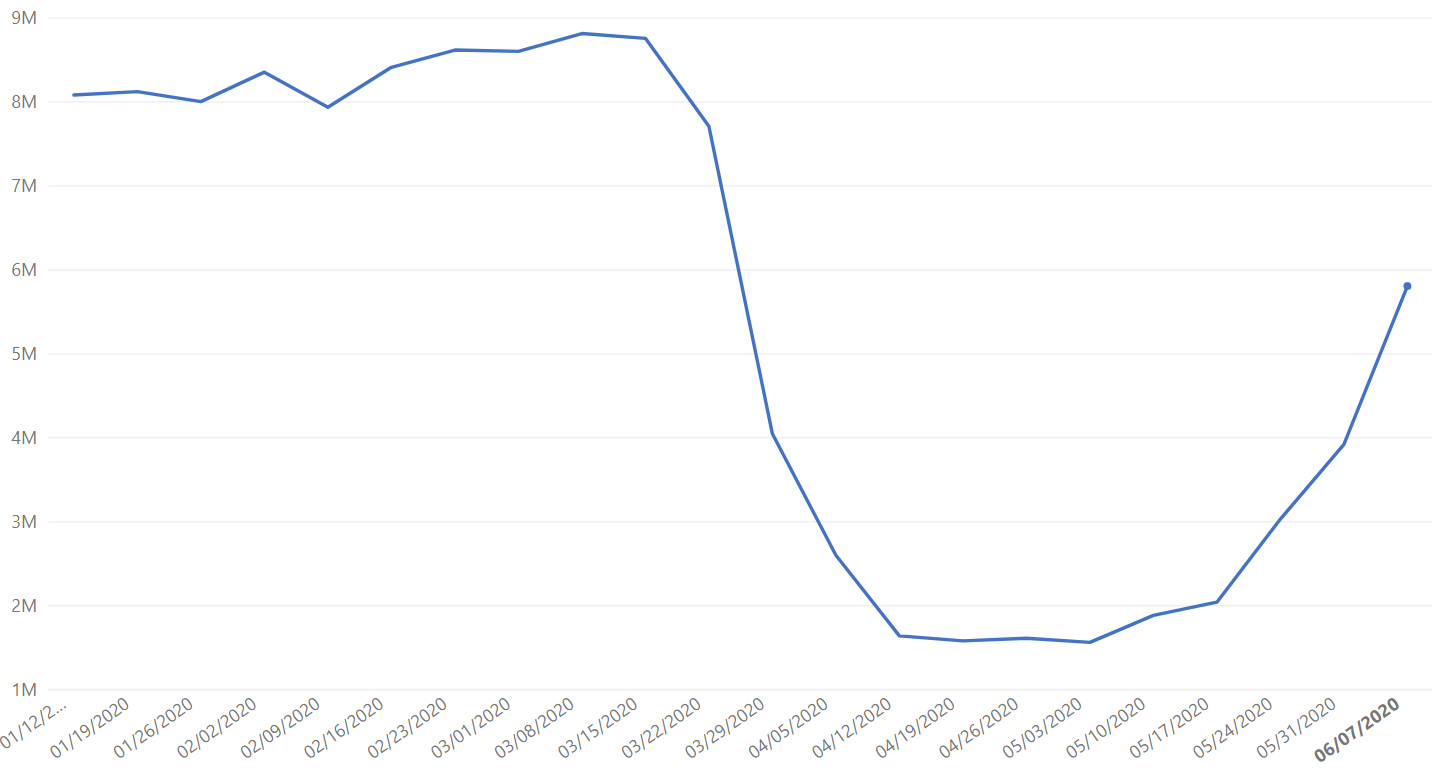
In the last week, global manufacturing production activity experienced its second biggest growth spike since the recovery began in early May at 48% week-over-week. According to our most recent data, this increase is only slightly less than the largest surge in production levels to date, which occurred the third week in May.
Additionally, worldwide production levels have now reached ~65% of what they were during the peak of 2020 production in mid-March, which reflects a 20 percentage point increase week-over-week to close that gap.
Global data set
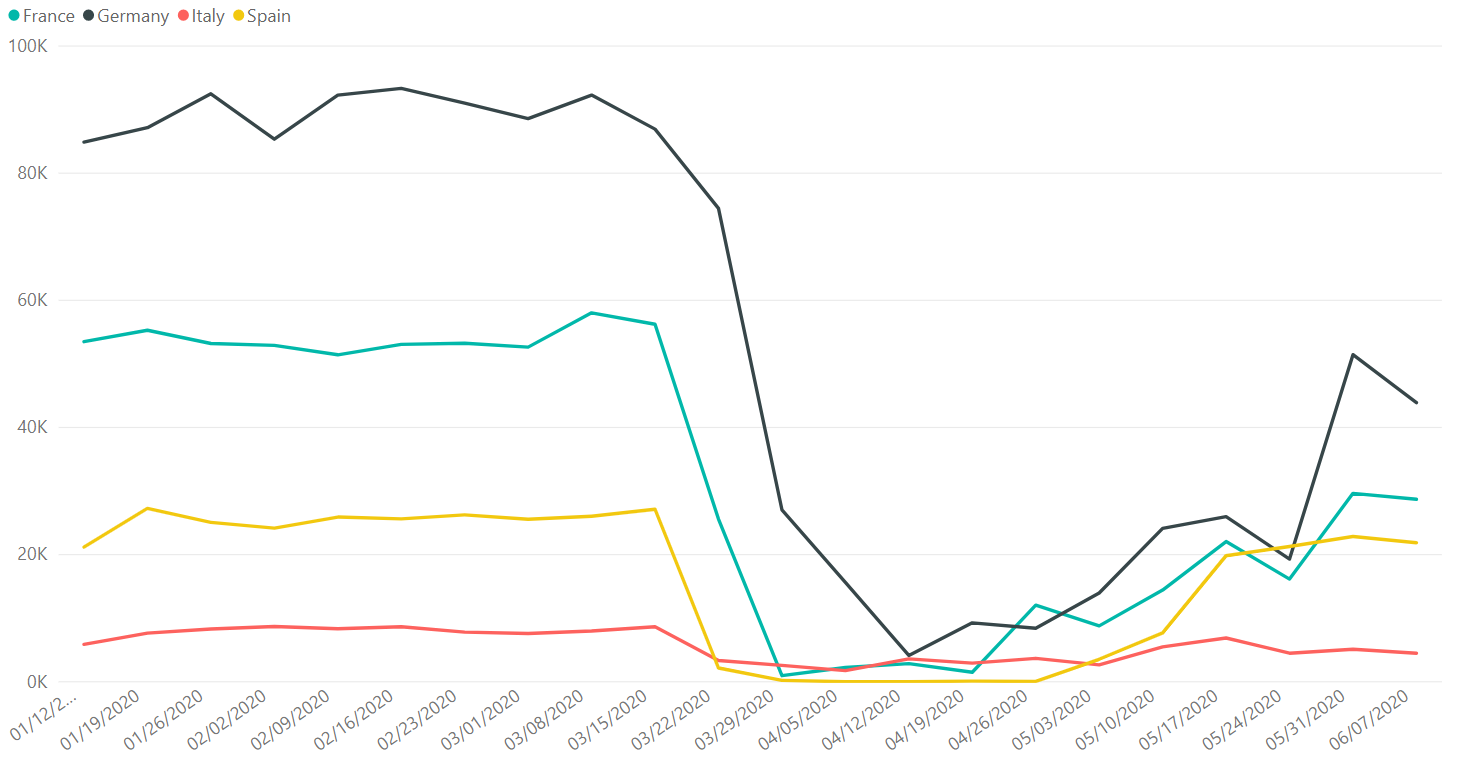
Europe also continues to see an increase. As reported last week, the growth is driven by countries like the Czech Republic and Romania while countries such as France, Germany, Italy and Spain experienced some slight dips over the last week.
France, Germany, Italy, Spain data set
However, North America is surging, posting a staggering 54% growth in production transactions in the last week. Even as the United States and Mexico see a slight uptick in COVID-19 cases, plans to reopen manufacturing facilities and other businesses have continued to move forward. This week, Daimler Trucks North America has reopened all nine of its manufacturing operations across North America, and the major automotive OEMs that resumed business three weeks ago have been working hard to meet consumer demand.
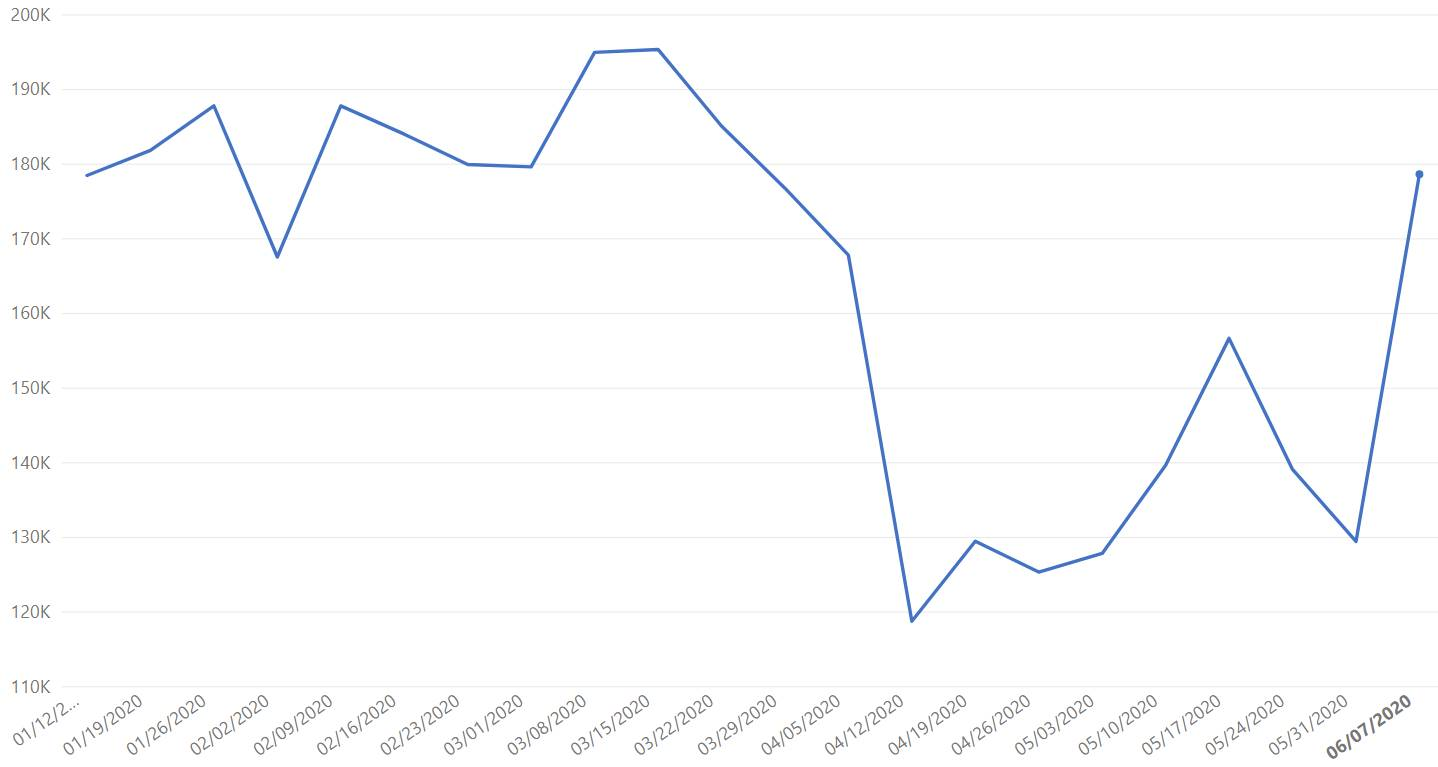
While every industry that Plex monitors is now experiencing growth in some capacity, this is especially evident in food and beverage, which grew by 38% last week, its highest jump since recovery began in mid-April.
Food and beverage data set
In fact, as seen in the chart below, production activity from last week neared or surpassed the pre-COVID levels from the early part of the year.
Anonymized individual food & beverage manufacturing data set (this chart compares the average of pre-pandemic production output with production output from June 1-7)
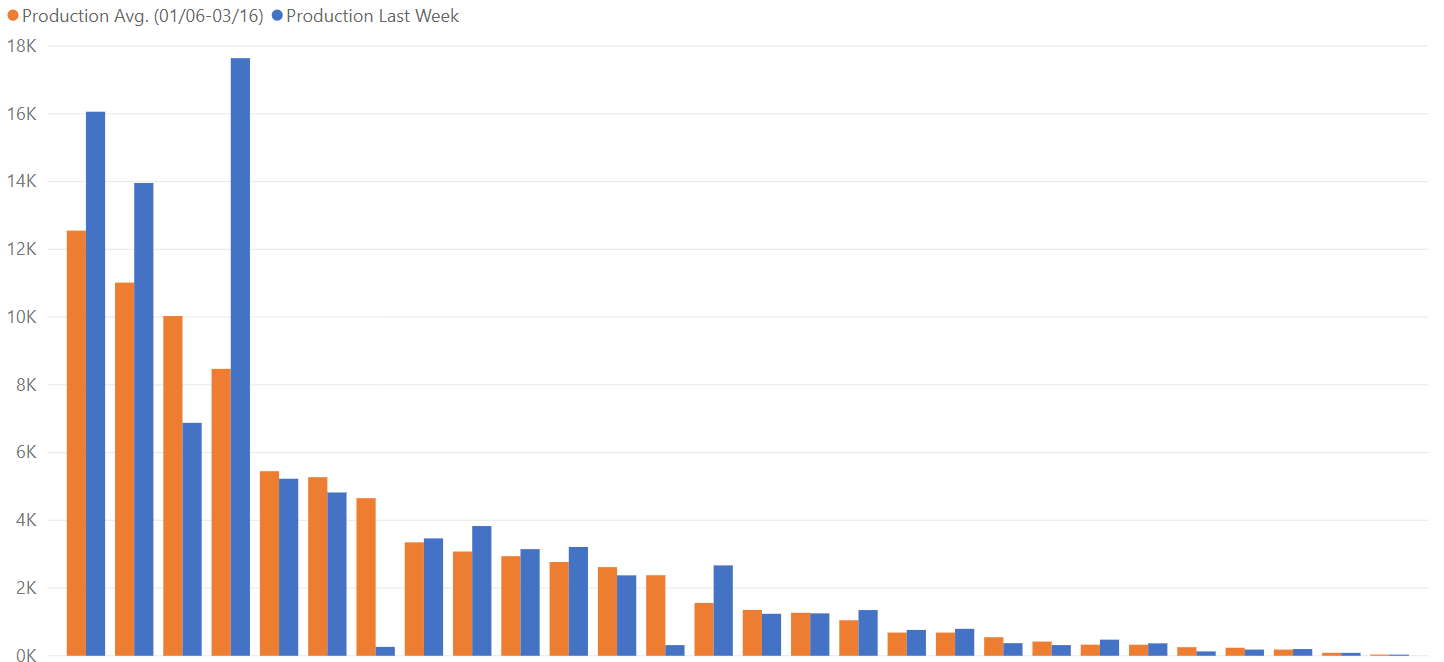
We saw a surge in consumer demand for packaged and processed food due to many shelter-in-place precautions during the height of the coronavirus outbreak, which caused some packaged goods manufacturers to experience high production levels.
Now, manufacturers that serve the restaurant industry are preparing to ramp up production as many countries and U.S. states have begun to allow dine-in service as part of their reopening plans. However, even as restaurants are given the green light to reopen doors, with limited capacity requirements and increased safety precautions, restaurants are proceeding with caution. With concerns about the impact of social distancing on profits and uncertainty of customers’ comfort level to return to dining in, those manufacturers supplying restaurants may see a slower recovery rate than their packaged food counterparts.
While we remain optimistic about the growth in worldwide manufacturing, it is unclear how long this momentum will be sustained. Even as the world begins to emerge from the depths of COVID-19 and begins to loosen restrictions, a second potential wave of coronavirus is still top of mind. In the coming months, fluctuating customer demand and confidence across industries will likely play a large role in determining the trajectory of the manufacturing industry’s rebound, both short and long term.
Details on the Data Source & How to Interpret Graphs
Plex Systems solutions are cloud-based, giving us access to 20 years of anonymized, compiled operational data from the approximately 700 manufacturers we serve. This group collectively runs 1,200 active production facilities in 29 countries, representing the aerospace, automotive, fabricated metals, food and beverage, industrial machinery, and plastics and rubber industries. For scale, in the fourth quarter of 2019 alone, this group together processed over 1.4 million shipments. Daily, they record upwards of 8 billion transactions (such as barcode scans, moved inventory, shipments, etc.).
Note this data reflects production transactions from January 1, 2020 to June 7, 2020. There is a margin of error of +/- 2%
About the Author
Jerry Foster Chief Technology Officer, Plex Systems
Jerry Foster is CTO and leads our technology strategy, along with research and design initiatives focused on next-generation cloud solutions for the manufacturing enterprise. A founding member of the Plex team, Jerry has been instrumental in the entire evolution of Plex, overseeing the technical transitions in each phase of our growth. Jerry earned his degree in Computer Science at Liberty University.